
Particle Models of Solids, Liquids, and Gases
Students use particle diagrams and temperature data to explain how heating or cooling changes particle motion and the state of a substance without creating a new substance.
Illustrations are auto-generated and may be placeholders. They can be refreshed to match the narration.
Review the Three States of Matter
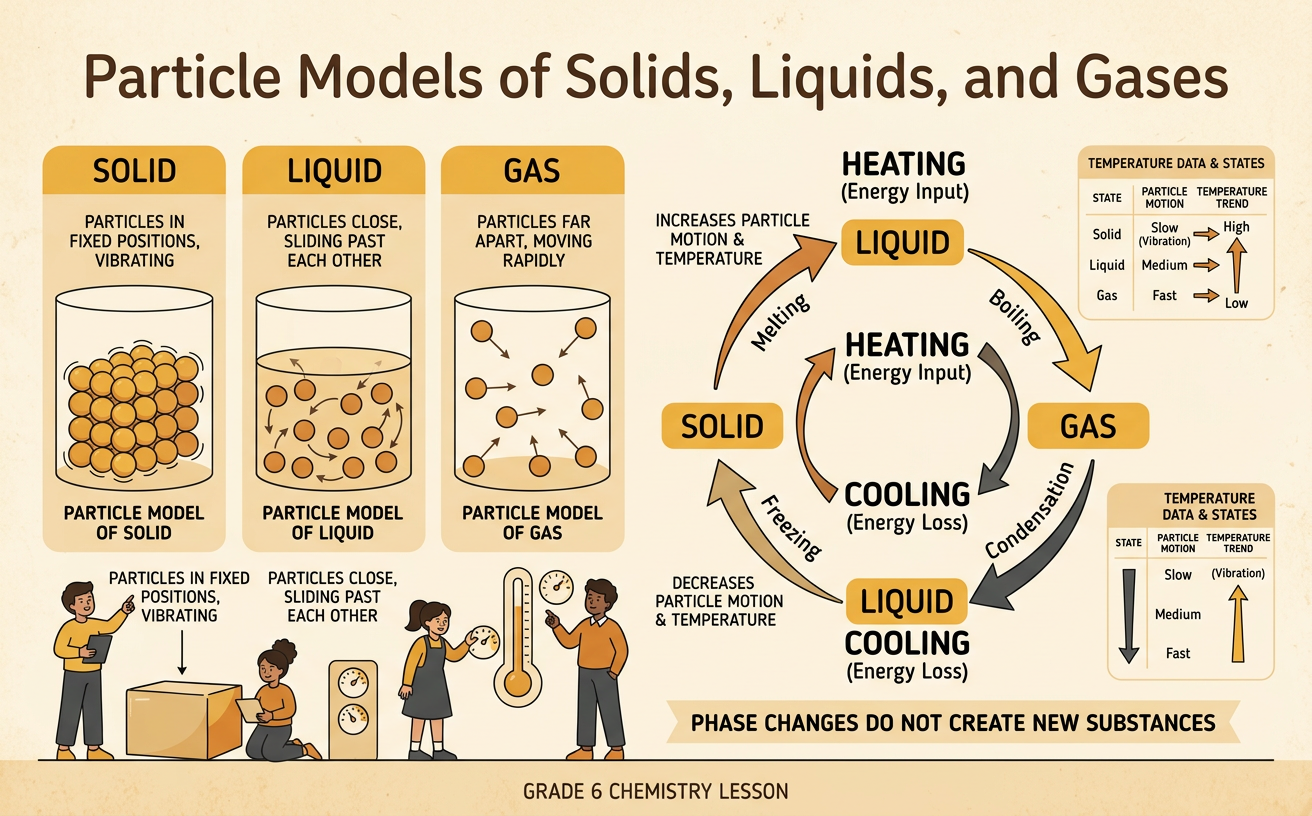
Matter is made of tiny particles that are always moving. In a solid, particles vibrate around fixed positions, so the solid keeps its own shape and volume. In a liquid, particles remain close together but slide past one another. A liquid keeps its volume but takes the shape of its container. In a gas, particles are far apart and move freely in all directions. A gas spreads out to fill its container. Water provides a familiar example: ice is solid water, liquid water can be poured, and water vapor is a gas. In all three states, the particles are still water particles. A change of state changes particle motion and arrangement, but it does not create a new substance.

Compare Particle Arrangements
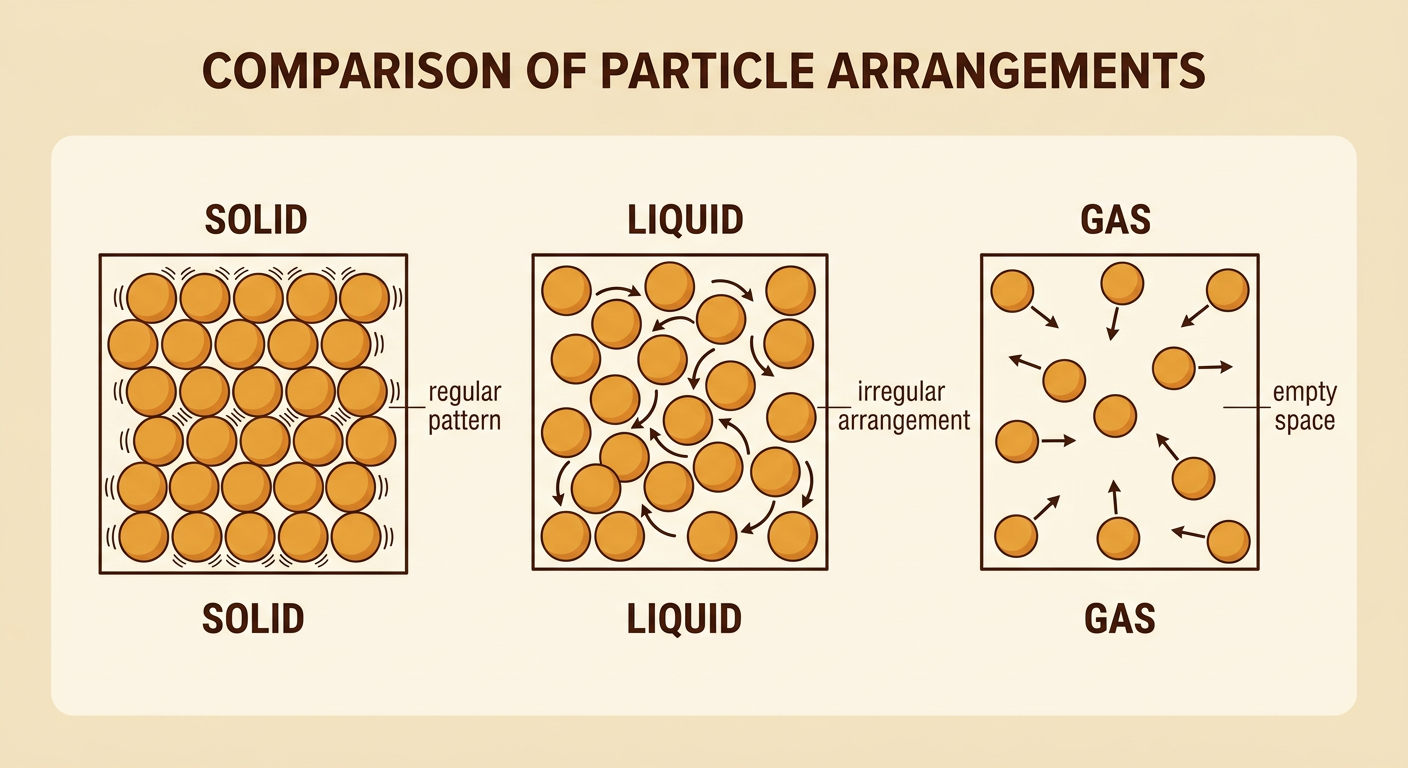
Particle diagrams use circles or dots to represent particles that are too small to see directly. Look at both spacing and arrangement when identifying a state. Solid particles are tightly packed in a regular pattern, and each particle vibrates in place. Liquid particles are also close together, but their arrangement is irregular and can change as particles move around one another. Gas particles have much more empty space between them and travel in different directions. For example, particles in an ice cube stay in an organized structure, while particles in melted water can slide and allow the water to flow. Water vapor particles spread through the available space. The circles in a model are not drawn to actual scale, and the spaces do not contain air unless air particles are specifically shown.
Connect Temperature and Particle Motion
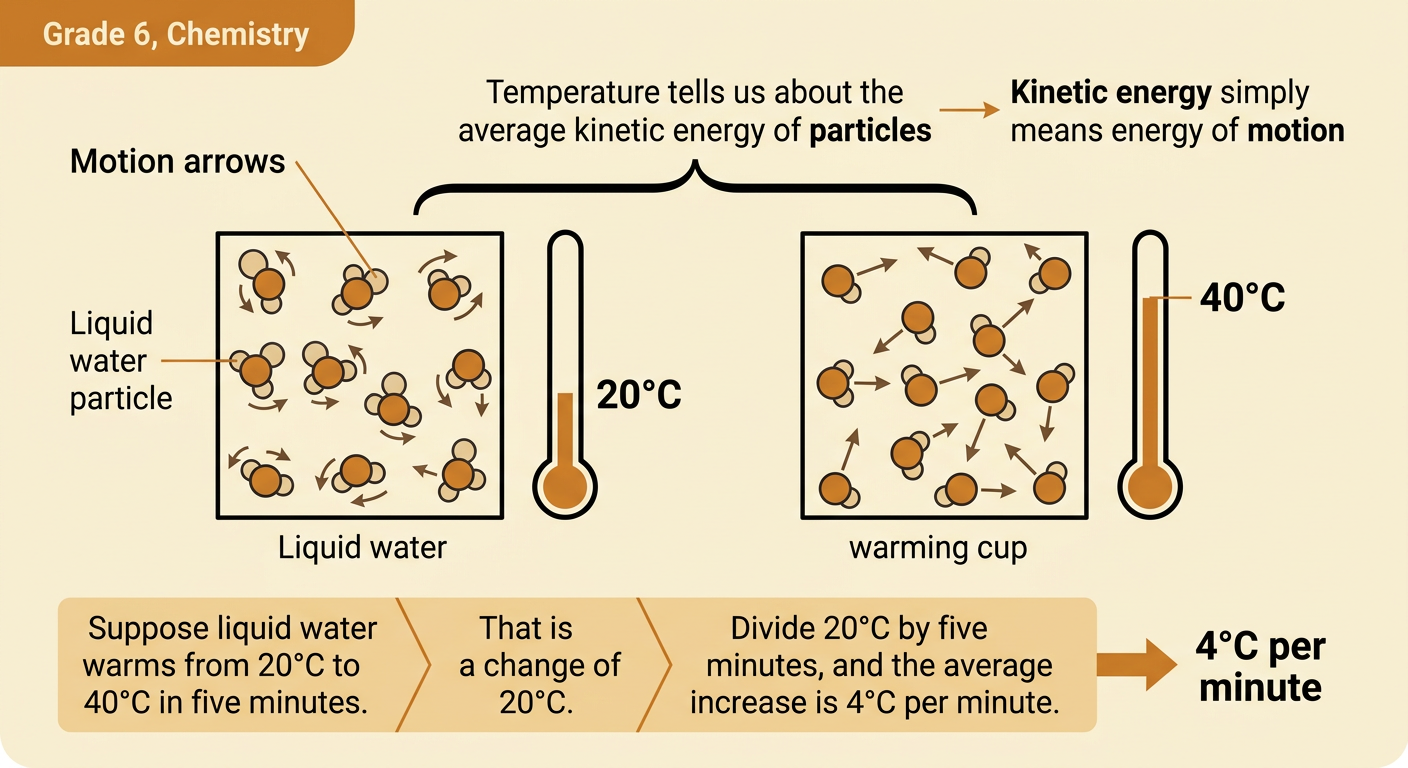
Temperature measures the average kinetic energy of a substance’s particles. Kinetic energy is energy of motion. When thermal energy is added, the particles generally move faster, and the temperature usually rises. When thermal energy is removed, the particles generally move more slowly, and the temperature usually falls. Suppose a cup of liquid water warms from 20°C to 40°C in 5 minutes. Its temperature increases by 20°C, so the average rate of increase is 20°C ÷ 5 minutes, or 4°C per minute. The warmer water particles have greater average motion than they did at 20°C. Individual particles do not all move at exactly the same speed. During a state change, added or removed energy changes particle arrangement, so temperature can remain steady for a time.
Model Melting and Freezing
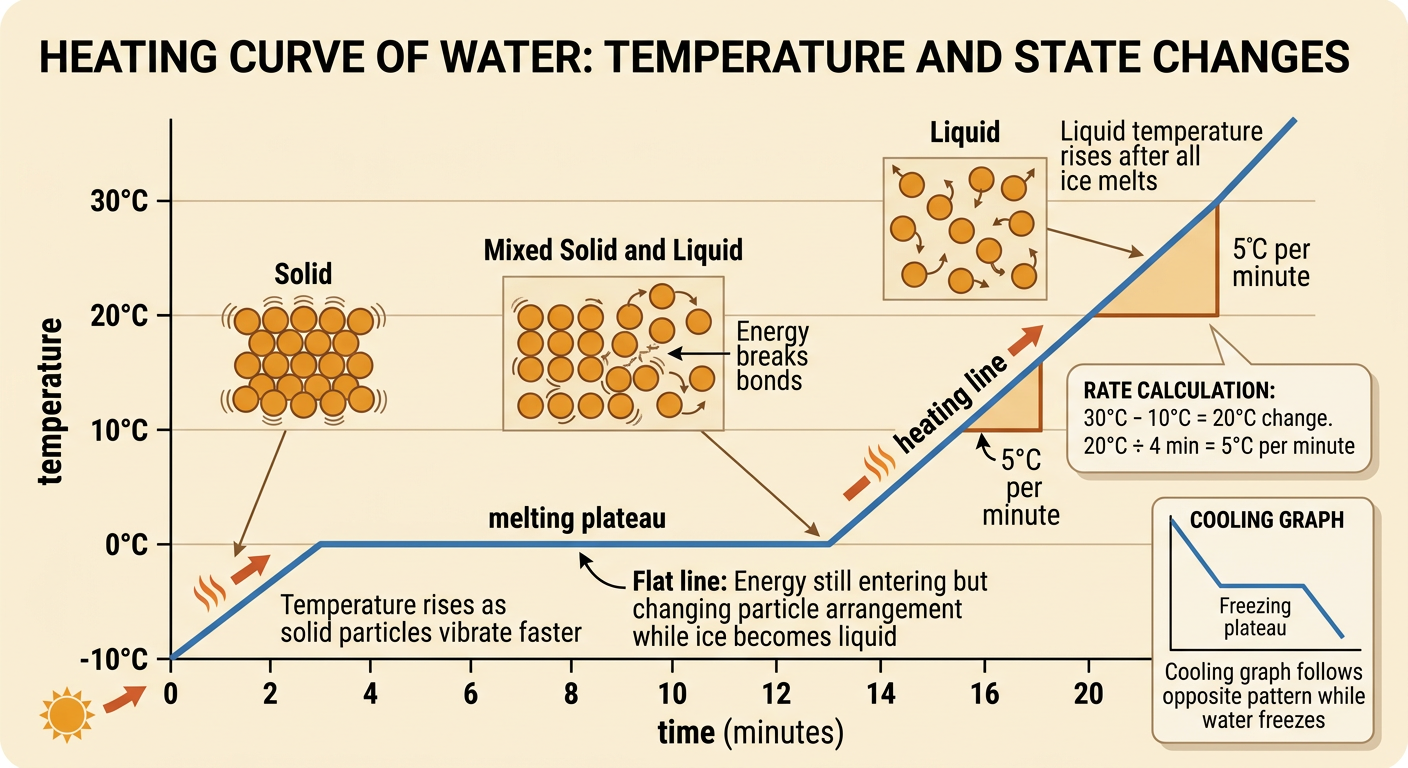
Melting occurs when a solid absorbs thermal energy and becomes a liquid. As ice is heated, its particles vibrate more. At the melting point, added energy helps particles break out of their fixed arrangement and begin sliding past one another. The substance remains water; no new substance forms. Freezing is the reverse process. When liquid water loses thermal energy, its particles move more slowly. At the freezing point, they become organized into fixed positions, forming solid ice. For example, water placed in a freezer transfers thermal energy to the colder surroundings and eventually freezes. For pure water at standard atmospheric pressure, melting and freezing occur near 0°C. While the state change is happening, the temperature can stay near 0°C even though energy continues to be transferred.

Interpret a Heating and Cooling Graph
A temperature-time graph combines numerical data with evidence about particle behavior. Imagine ice is heated at a steady rate. The graph rises from −10°C to 0°C as solid particles vibrate faster. It then forms a flat section near 0°C while the ice melts. Energy is still entering, but it is changing the particle arrangement rather than raising the temperature. After all the ice has melted, the liquid temperature rises. A cooling graph follows the opposite pattern: liquid water cools to 0°C, remains near 0°C while freezing, and then the solid cools further. To compare rates, divide temperature change by time change. If liquid water warms from 10°C to 30°C in 4 minutes, its average warming rate is 20°C ÷ 4 minutes, or 5°C per minute.
Apply the Model to Everyday Energy Choices
Particle models can help people make decisions about heating and cooling. A refrigerator removes thermal energy from food, slowing particle motion and helping food remain safe longer. However, every refrigerator uses electricity, which costs money and may require fuel to be burned at a power plant. Leaving the refrigerator door open lets warmer air enter, so the appliance must use more energy to cool the inside again. Families can reduce costs by closing the door quickly, setting a safe but not unnecessarily cold temperature, and maintaining the door seal. Communities also make choices about insulation, efficient appliances, and reliable access to heating and cooling. These decisions affect household budgets, energy demand, health, and the environment. Understanding thermal energy helps people compare benefits and costs while protecting individual and societal well-being.
