
Pixel Map: Represent Our Classroom on a Grid
Students use colored grid squares and simple symbols to represent classroom objects, then interpret a partner’s map as a computer-style data model.
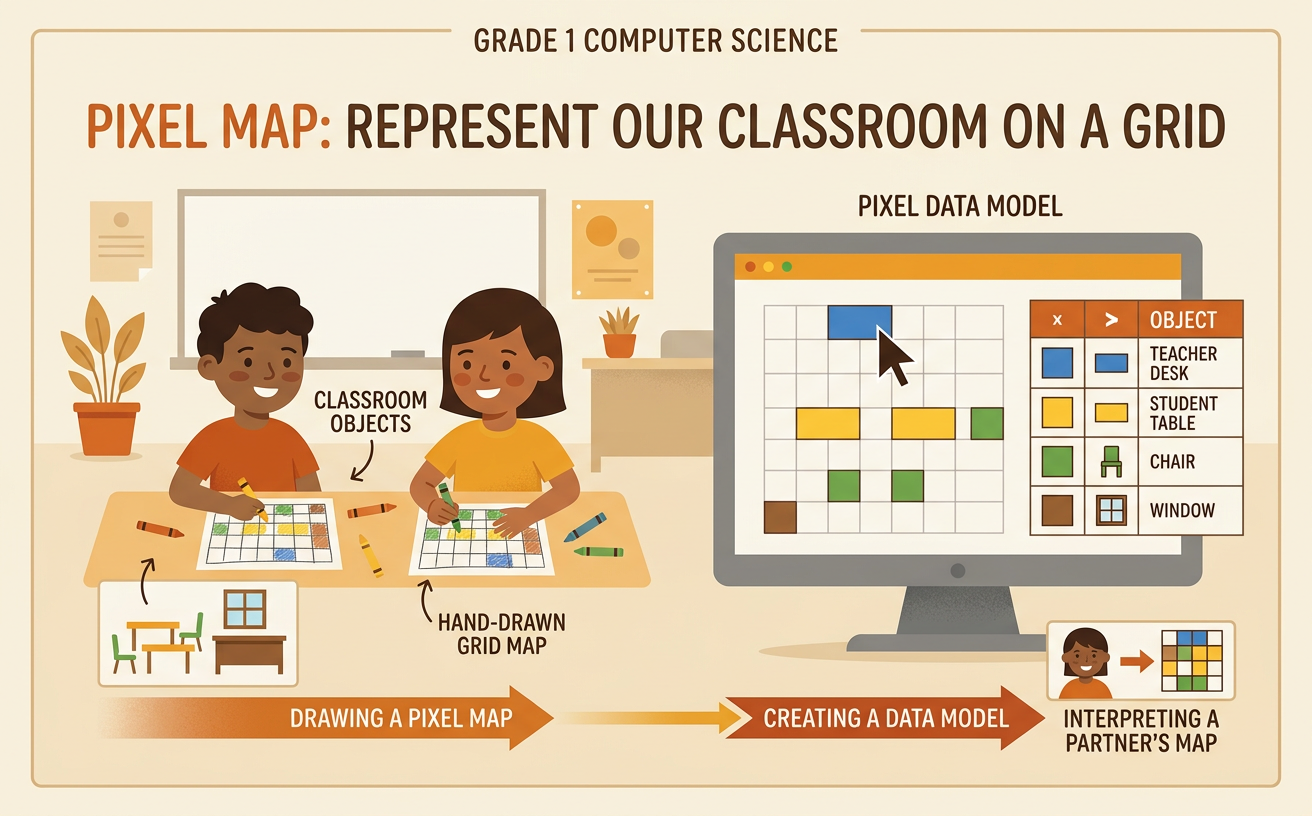
Illustrations are auto-generated and may be placeholders. They can be refreshed to match the narration.
Explore Grids and Pixels
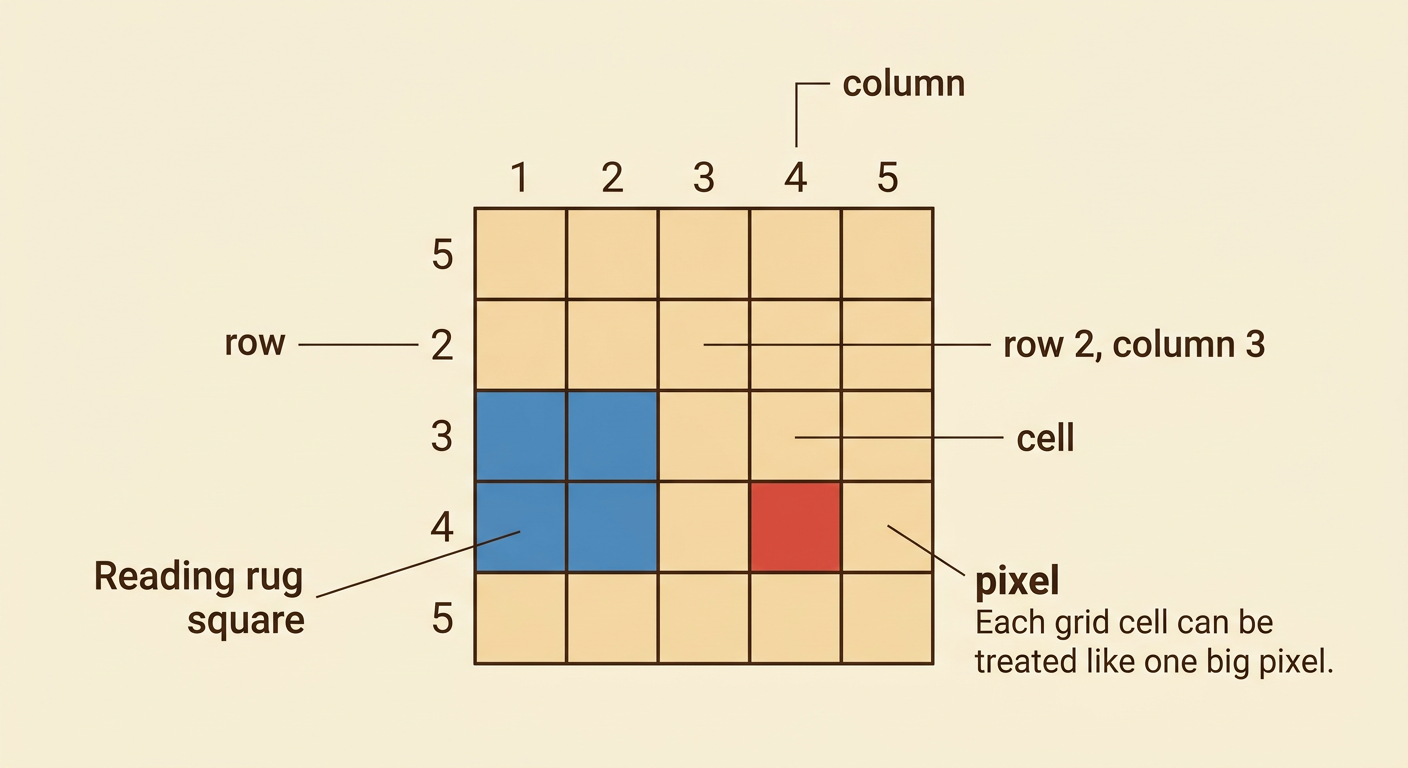
A grid is made of rows and columns of squares. A row goes from side to side. A column goes from top to bottom. Each small square is called a cell. On a computer screen, a tiny square of color is called a pixel. We can use grid cells like large pixels to make a simple picture or map. For example, color four cells blue to show a square reading rug. Color one nearby cell red to show a small table. The picture will not show every detail, but it will show the objects’ shapes and locations. Point to a cell and describe it by its row and column, such as “row 2, column 3.”
Choose Symbols for Classroom Objects
A symbol is a simple picture, shape, or color that stands for something. Mapmakers use symbols because real objects have too many details to draw in a small space. Choose a symbol that is easy to draw and recognize. For example, a brown rectangle can mean a desk, a blue square can mean a rug, and a green circle can mean a plant. Use the same symbol every time you show that kind of object. Make a map key that explains what each symbol means. If a star means the classroom library, draw a star in the key and write “library” beside it. A clear key helps another person read your map without guessing.

Build a Classroom Grid Map
Now build a map of the classroom on a grid. First, decide which side of the grid will be the front of the room. Next, look at where large objects are placed. Add the walls, door, board, desks, rug, shelves, and other important objects. Use colored squares or your chosen symbols. Place each symbol in about the same location as the real object. For example, if the board is along the front wall, draw a long rectangle across the top row. If four desks are in the middle, place four desk symbols in the center cells. Leave open cells where people can walk. Check your map by looking around the classroom and comparing each object’s shape and location.

Exchange and Interpret Maps
Exchange maps with a partner. Do not explain your map right away. Let your partner use the grid, symbols, and map key to interpret the information. Your partner can describe what is shown and where it is located. For example, a partner might say, “The green plant is beside the window,” or “The reading rug is behind the desks.” Ask questions when something is unclear. You might ask, “Does this rectangle mean a table or a shelf?” Then compare the map with the real classroom. Notice which parts were easy to understand and which parts need changes. Add a missing label, fix a symbol, or move an object to a better cell. Testing a model helps make it clearer and more useful.

Reflect on Digital Representations
A classroom grid map is a data model. A model represents important information about something real. Your map stores information in cells using colors, shapes, and symbols, much like a computer stores a picture using pixels. The map is useful because it can show where objects are and how people might move through the room. However, it does not show every detail. A desk symbol may not show the desk’s legs, books, or scratches. Think about which information you included and which information you left out. For example, your map may show a clear path from the door to the rug but not show the rug’s soft texture. Explain one way your model is helpful and one way it could be improved.
