
Planning and Conducting a Fair Scientific Investigation
Students develop a testable question, identify variables, plan and conduct a fair test, organize repeated measurements, and use the evidence to explain whether the results support their prediction.
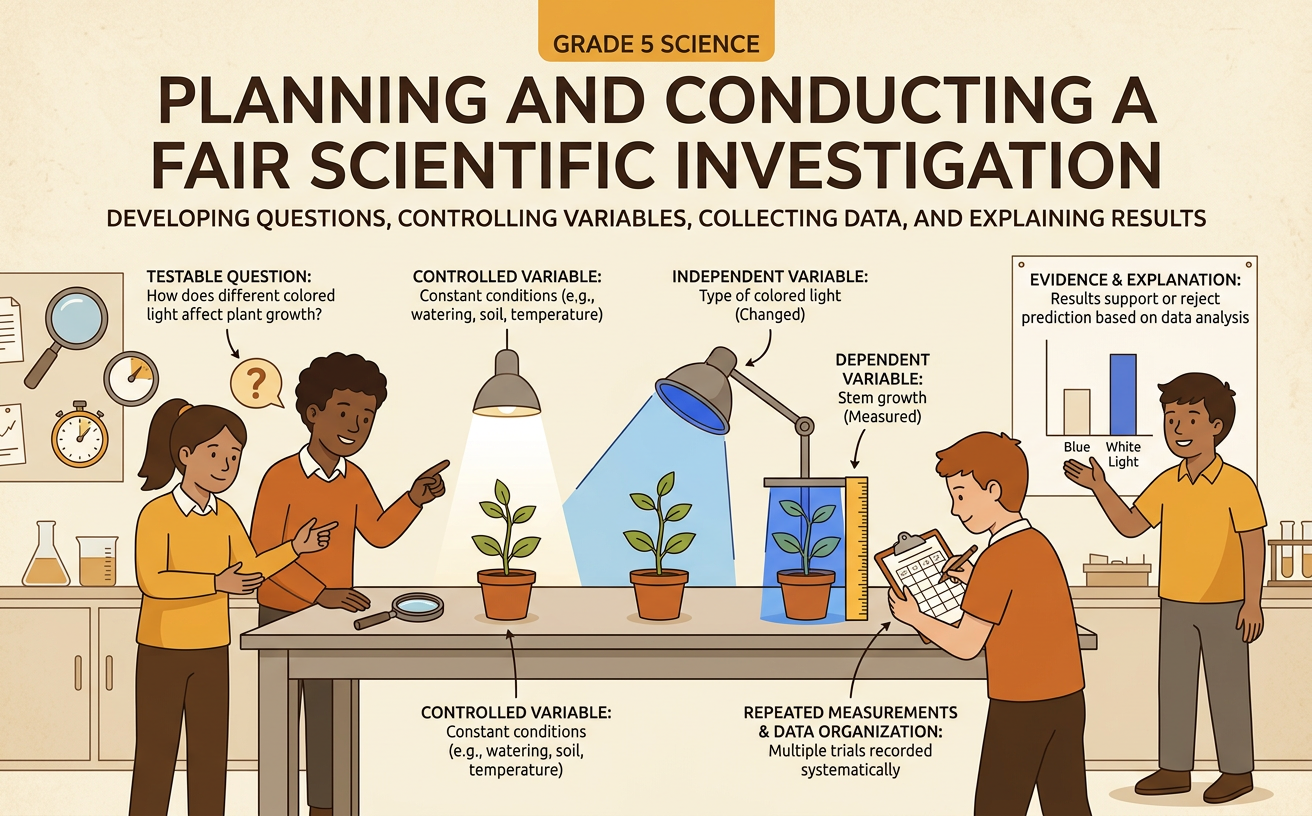
Illustrations are auto-generated and may be placeholders. They can be refreshed to match the narration.
Ask a Testable Question
A testable question can be answered by changing one factor, measuring a result, and collecting evidence. Begin by observing something interesting and doing brief research with reliable sources, such as science books, museum websites, or instructions from your teacher. Then make the question specific. For example, after reading about air resistance and gravity, you might ask, “How does the number of paper clips attached to a paper helicopter affect the time it takes to fall two meters?” This question names what will change and what will be measured. It can be tested safely with available materials. A question such as “Which helicopter is best?” is not testable until “best” is defined. Good testable questions often follow this pattern: How does changing one factor affect a measurable result?
Make a Prediction
A prediction states what you think will happen before you conduct the investigation. It should answer the testable question and include scientific reasoning. For the paper helicopter investigation, you might predict, “If a second paper clip is added, then the helicopter will take less time to fall because the greater weight will pull it downward more quickly.” Use an if-then-because statement to connect the changed factor, the expected result, and your reasoning. Research can help you form a reasonable prediction, but a prediction is not a guess that must be correct. The investigation may support it or may show a different pattern. Record the prediction before testing so that you do not change it to match the results. Scientists learn from unexpected results as well as expected ones.
Identify and Control Variables
Variables are factors that can change in an investigation. The independent variable is the factor you purposely change: the number of paper clips. The dependent variable is the result you measure: the helicopter’s fall time. Controlled variables are kept the same so the comparison is fair. Use identical paper helicopters, the same drop height, the same release method, the same location, and the same timer procedure. Test one paper clip and two paper clips, but do not also change the paper size or height. Consider possible failure points before testing. A bent helicopter blade, a strong air current, an early stopwatch start, or a helicopter hitting a desk could make a trial unreliable. Planning how to prevent or record these problems makes the evidence more trustworthy.
Conduct Repeated Trials
One trial may be affected by a small timing error or an unusual flight, so conduct repeated trials for each condition. Make two identical paper helicopters. Attach one paper clip to the first and two paper clips to the second. Mark a two-meter drop height in a safe indoor area. One student releases a helicopter without pushing it while another starts the stopwatch at release and stops it when the helicopter reaches the floor. Record the time to the nearest one-fourth second. Complete at least five trials for each number of clips, using the same procedure each time. If a helicopter hits an object or a timer is not started correctly, label that trial as a failure and repeat it. Never erase an unexpected result simply because it does not match the prediction.
Organize and Analyze Data
Record every valid measurement in a labeled table, including units. Suppose the one-clip fall times are 2, 2 1/4, 2 1/4, 2 1/2, and 2 1/4 seconds. The two-clip times are 1 1/2, 1 3/4, 1 3/4, 2, and 1 3/4 seconds. Make a line plot for each condition. Draw a horizontal number line from 1 1/2 to 2 1/2 seconds in one-fourth-second intervals. Place one X above a value for every measurement. The clusters show that the one-clip helicopter usually fell near 2 1/4 seconds, while the two-clip helicopter usually fell near 1 3/4 seconds. The typical times differ by 1/2 second. Look for patterns, differences, and unusual values instead of focusing on only one trial.
Make an Evidence-Based Conclusion
A conclusion answers the testable question by using measurements as evidence. First, state whether the results support the prediction. Then cite the pattern in the data and explain what it means. For example: “The results support my prediction that adding a second paper clip would reduce the paper helicopter’s fall time. The one-clip trials clustered around 2 1/4 seconds, while the two-clip trials clustered around 1 3/4 seconds, a difference of 1/2 second. Because the number of clips was the only planned change, the evidence suggests that the extra clip caused the helicopter to fall faster in this test.” Also discuss limits. Human stopwatch reaction time could affect the measurements. A stronger investigation could use more trials or video timing. Do not claim that the evidence proves the result for every helicopter or situation.