Planning and Evaluating a Scientific Investigation
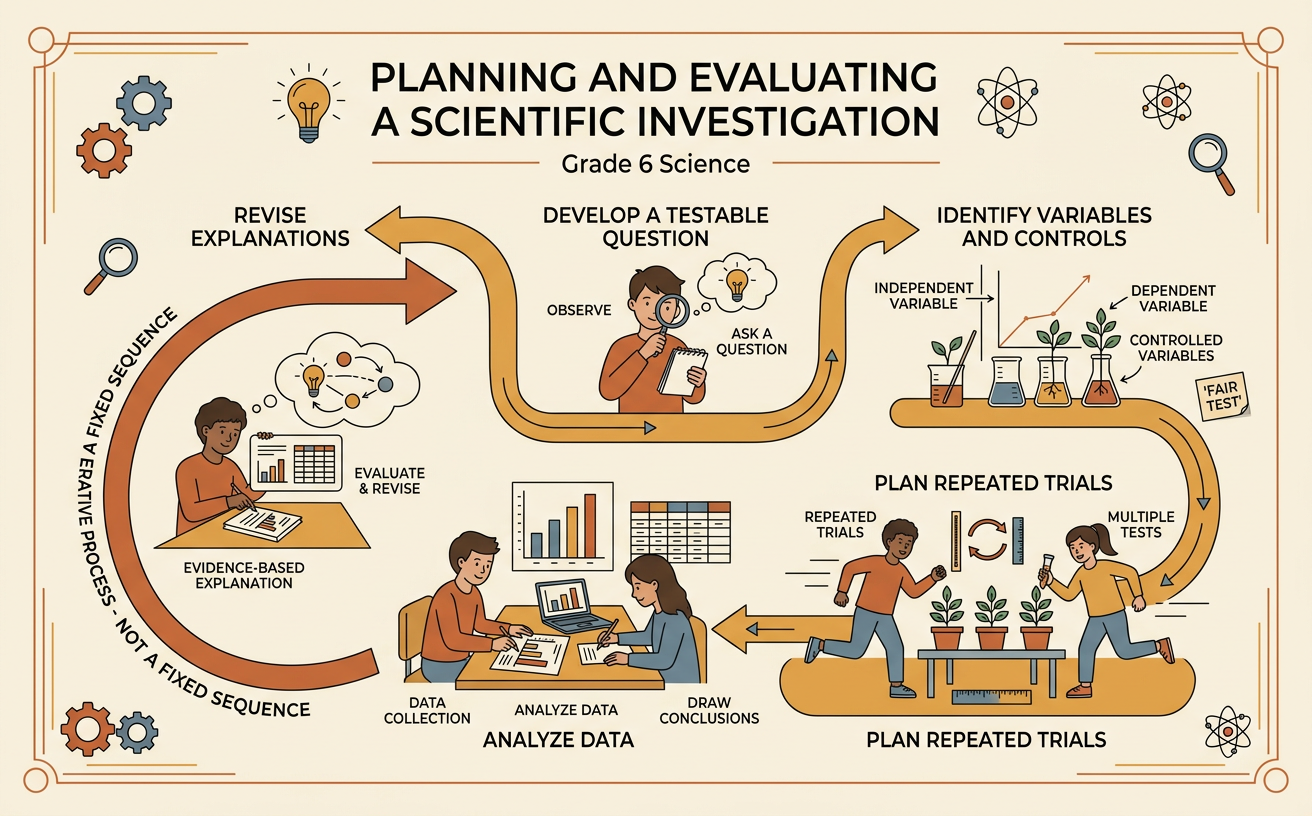
Students develop a testable question, identify variables and controls, plan repeated trials, analyze data, and revise explanations based on evidence while recognizing that scientific investigation is an iterative process rather than a fixed sequence.
Illustrations are auto-generated and may be placeholders. They can be refreshed to match the narration.
From Observations to Testable Questions
Scientific investigations often begin with an observation. Suppose you notice that sugar seems to disappear faster in warm tea than in cold tea. You can turn this observation into a testable question: How does water temperature affect the time needed for a sugar cube to dissolve? A strong testable question identifies what will be changed and what will be measured. It is narrow enough to investigate with available time, materials, and safety rules. Before planning, consult useful sources such as a science textbook, reliable reference website, or teacher-provided safety guide. These sources can clarify how dissolving works and what temperatures are safe, but they do not replace collecting your own evidence. Questions that ask for opinions or cannot be measured, such as “Which drink is best?” are not scientifically testable without being revised.
Hypotheses, Variables, and Controls
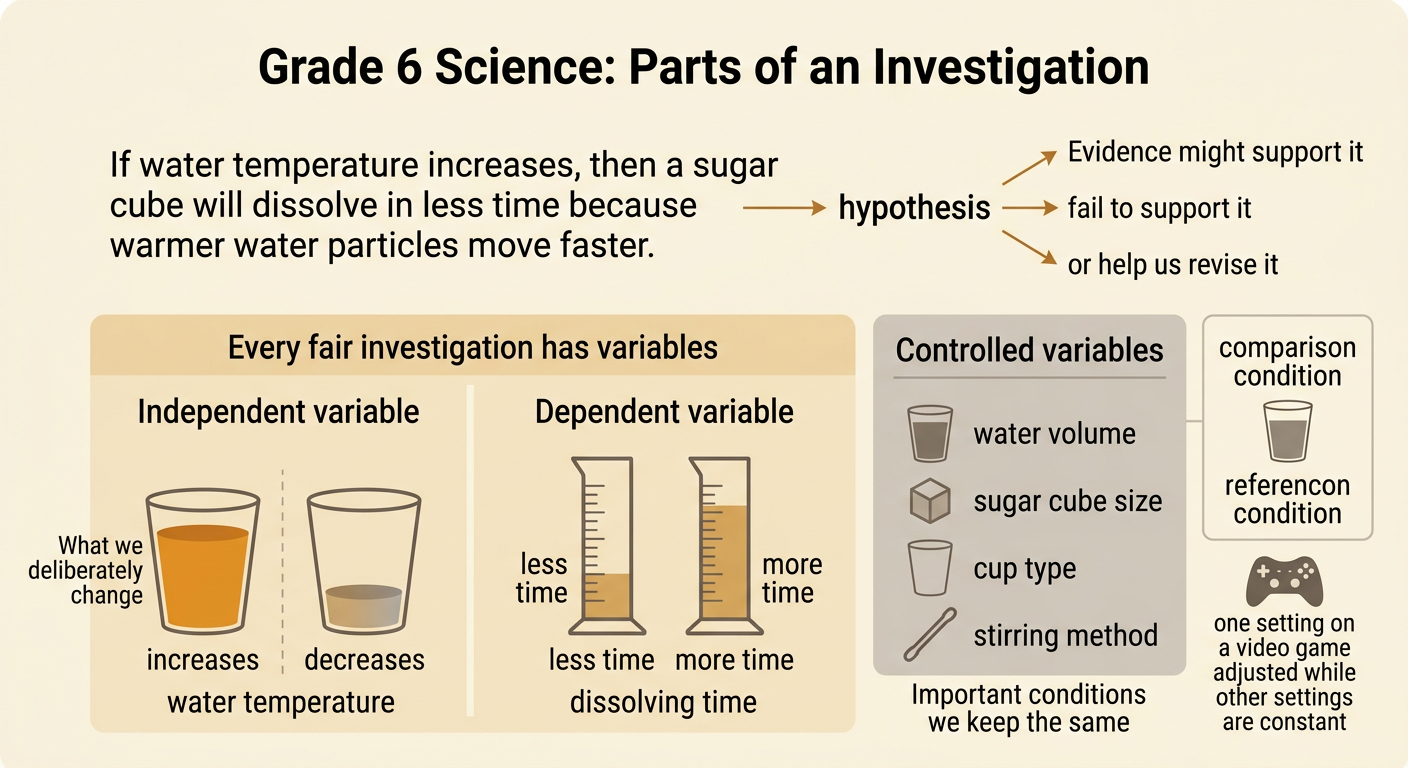
A hypothesis is a testable explanation or prediction supported by reasoning. For the sugar investigation, a hypothesis could be: If water temperature increases, then a sugar cube will dissolve in less time because warmer water particles move faster. The independent variable is the factor deliberately changed: water temperature. The dependent variable is the result measured: dissolving time in seconds. Controlled variables are conditions kept the same, including the water volume, sugar cube size, cup type, and stirring method. A control or comparison condition provides a useful baseline. Room-temperature water could serve as the comparison for colder and warmer water. Identifying these parts before testing helps you decide whether temperature, rather than another difference, caused the measured pattern. A hypothesis is not a guess that must be proven; evidence may support it, fail to support it, or lead to its revision.
Planning Fair Tests and Repeated Trials
A fair test changes one independent variable while keeping other important conditions constant. Write a numbered procedure detailed enough for another student to follow exactly. For example, measure 200 milliliters of water into identical cups, adjust the water to 10°C, 25°C, or 40°C, add one equal-sized sugar cube, stir at the same rate, and time how long the cube takes to dissolve. Record the result immediately. Include safety steps, such as using teacher-approved temperatures and handling glassware carefully. Conduct at least three trials at each temperature. Repeated trials provide sufficient data, reveal unusual results, and make the findings more reliable than one measurement. Randomizing the order of temperatures can also reduce the effect of changing room conditions or practice. Before starting, check that the materials, measurements, and data table match every step of the plan.
Organizing and Analyzing Data
Record measurements in a data table with clear headings and units. For each water temperature, list the dissolving time from every trial. Then calculate the mean time by adding the trial times and dividing by the number of trials. Suppose the mean times are 180 seconds at 10°C, 105 seconds at 25°C, and 55 seconds at 40°C. A graph makes this pattern easier to see. Place the independent variable, water temperature in degrees Celsius, on the horizontal x-axis. Place the dependent variable, mean dissolving time in seconds, on the vertical y-axis. Choose an even numerical scale and plot each value accurately. Look for patterns, differences, and outliers. An outlier should be checked, not automatically removed. Review the procedure and notes for a possible explanation, such as delayed timing, incomplete stirring, or a sugar cube of a different size.

Evidence-Based Conclusions and Revisions
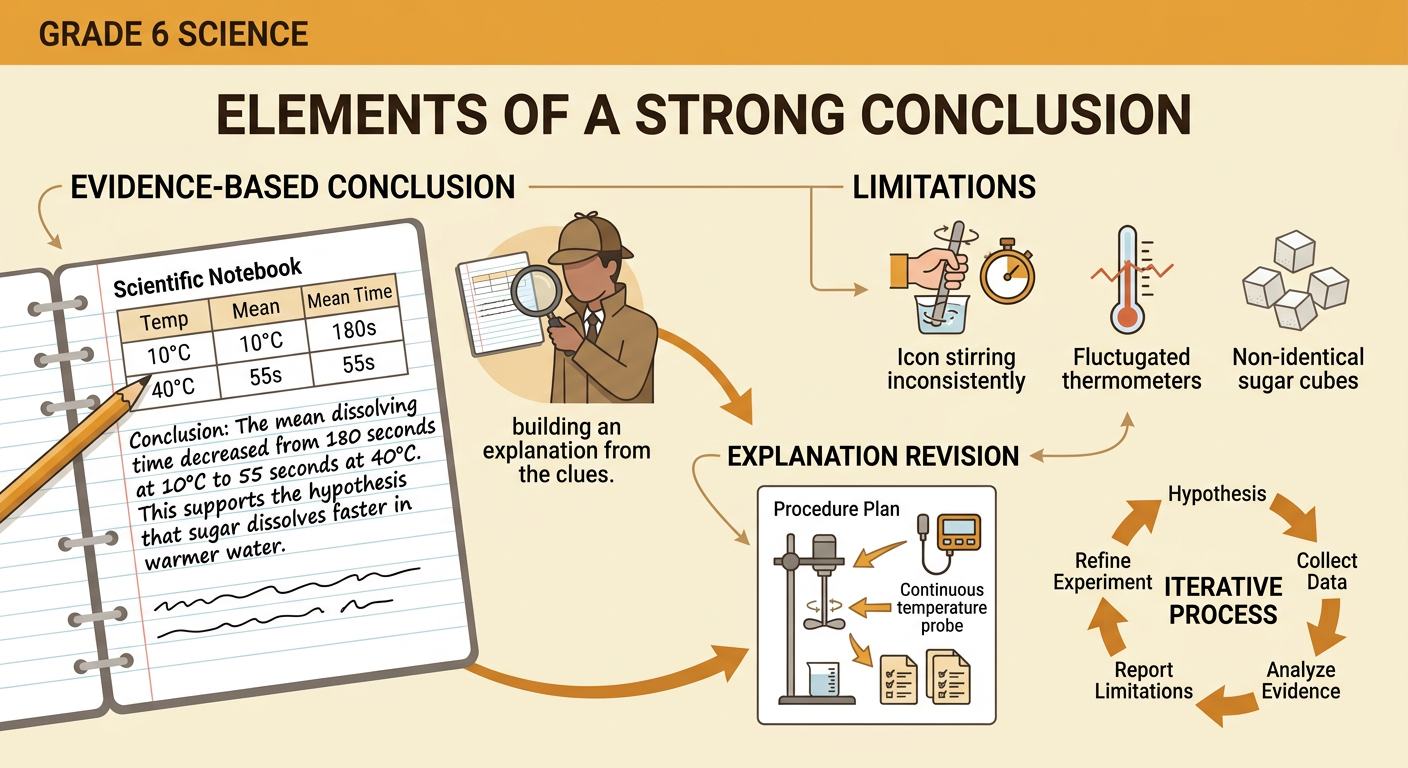
A conclusion answers the testable question using collected evidence. In this example, the mean dissolving time decreased from 180 seconds at 10°C to 55 seconds at 40°C. This evidence supports the hypothesis that sugar dissolves faster in warmer water. State what the data show without claiming more than the investigation tested. Also discuss uncertainty and limitations. Unequal stirring, small temperature changes, or slightly different sugar cubes could affect the results. If trials vary widely, improve the procedure by using a mechanical stirrer, monitoring temperature continuously, or completing more trials. New evidence may require revising the explanation or asking a new question, such as whether crushed sugar responds to temperature in the same way. Scientific investigation is iterative: researchers plan, test, analyze, explain, and revise. Revising an explanation is a strength because it makes the explanation better match the evidence.