
Plate Boundaries and Geologic Hazards
Students analyze maps of earthquakes, volcanoes, and tectonic plates to explain how plate interactions create predictable patterns of geologic hazards.
Illustrations are auto-generated and may be placeholders. They can be refreshed to match the narration.
Mapping Earthquakes and Volcanoes
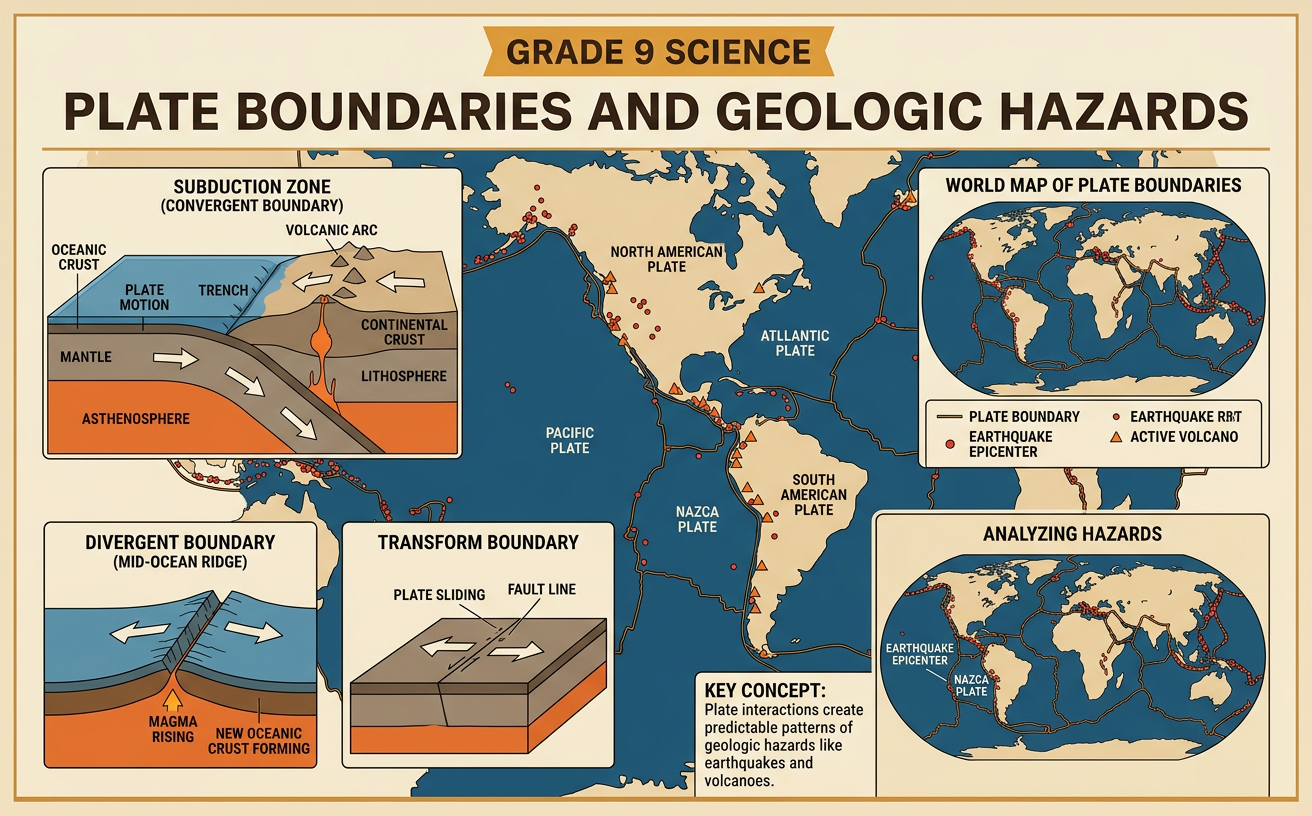
Earthquakes and volcanoes are not distributed randomly across Earth. When their locations are plotted on a world map, they form long, narrow belts that often match the edges of tectonic plates. Earthquake data usually include latitude, longitude, depth, and magnitude. Volcano data identify active or recently active volcanoes. For example, many earthquakes and volcanoes surround the Pacific Ocean in a pattern called the Ring of Fire. This pattern follows several plate boundaries, including the boundary where the Pacific Plate meets nearby plates. Some earthquakes also occur within plates, but they are less common. By comparing mapped hazard locations with plate boundaries, scientists can identify spatial relationships and infer where plates collide, separate, or slide past one another. Map symbols and legends help translate numerical location data into visible geographic patterns.

Identifying Plate Boundary Patterns
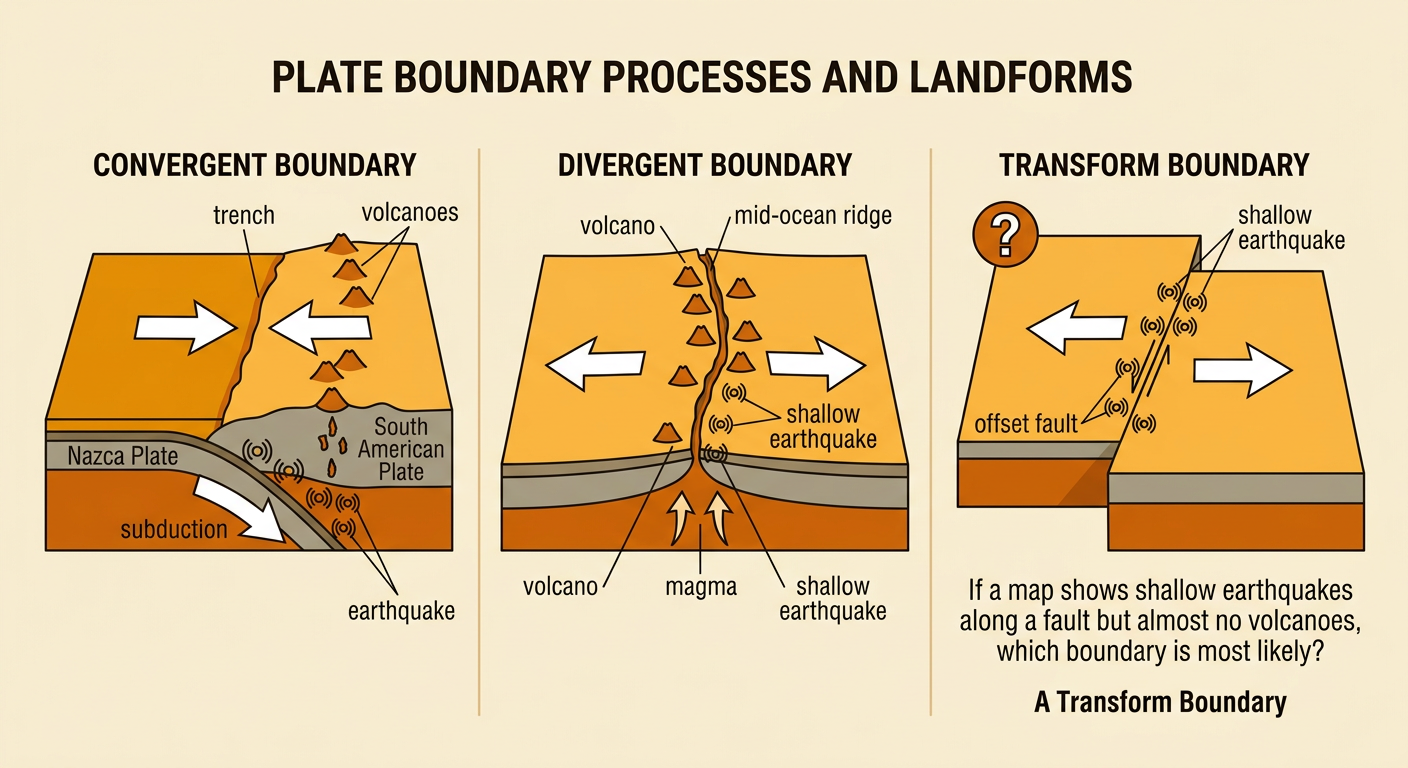
Mapped hazard patterns can reveal the type of plate boundary present. At convergent boundaries, plates move toward each other. These regions may contain a deep ocean trench, a line of volcanoes, and earthquakes that become deeper farther from the trench. The Andes Mountains provide an example: the oceanic Nazca Plate sinks beneath the continental South American Plate, producing earthquakes and volcanoes. At divergent boundaries, plates move apart, creating shallow earthquakes and volcanic activity along mid-ocean ridges or continental rifts. At transform boundaries, plates slide horizontally past each other, producing mostly shallow earthquakes but little or no volcanism. The San Andreas Fault is a transform boundary between the Pacific and North American Plates. Scientists compare plate-motion arrows, landforms, earthquake depths, and volcano locations to identify each pattern rather than relying on one feature alone.
Modeling Convection and Plate Motion
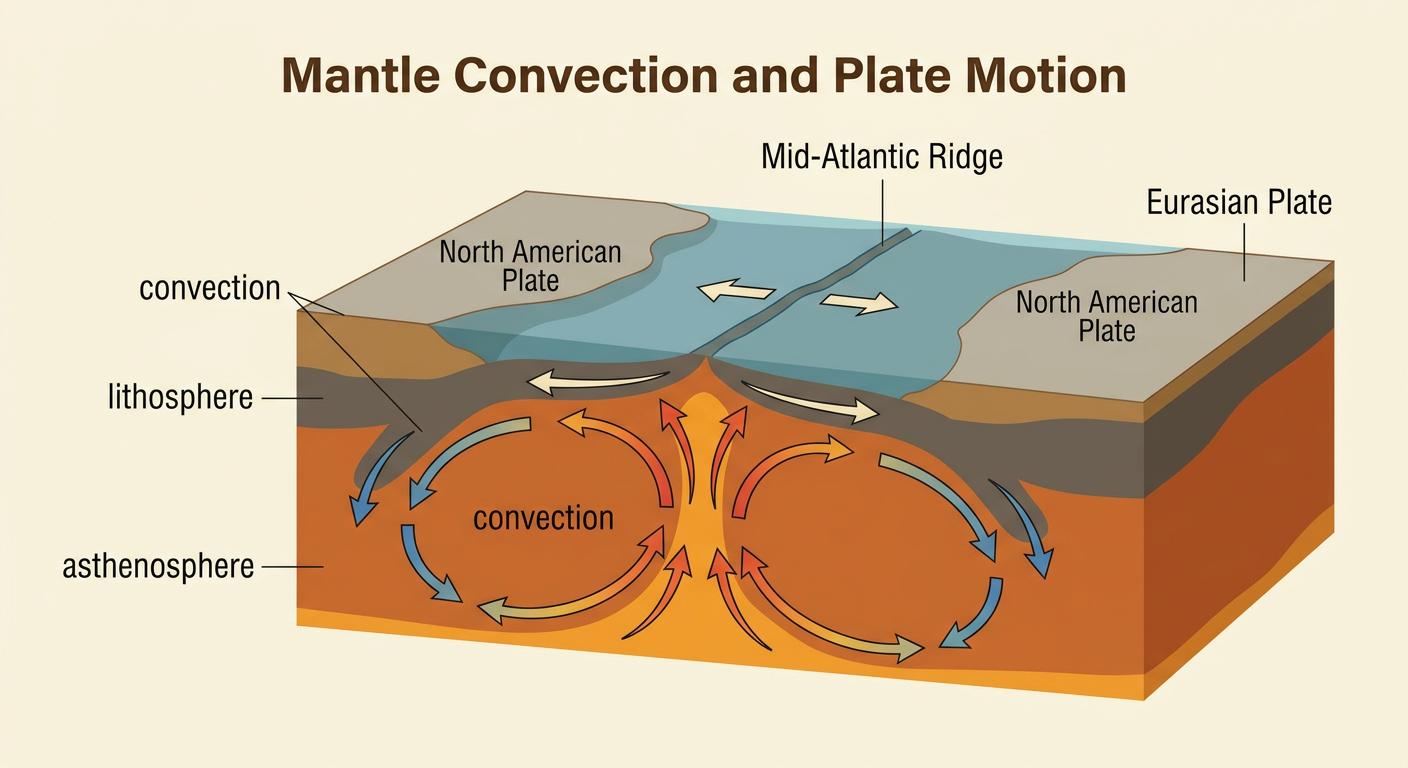
Plate motion is connected to the movement of hot, slowly flowing rock in Earth’s mantle. Heat from Earth’s interior makes some mantle material warmer and less dense, causing it to rise. Near the surface, the material spreads, cools, becomes denser, and eventually sinks. This continuous transfer of thermal energy and cycling of matter is called convection. Tectonic plates are part of the rigid lithosphere above the softer asthenosphere, and their movement is influenced by mantle flow, ridge push, and the sinking of dense slabs. A classroom model can use a heated fluid to show rising and sinking convection, but the mantle is solid rock that deforms extremely slowly rather than a liquid ocean. For example, hot mantle rises beneath the Mid-Atlantic Ridge as the North American and Eurasian Plates move apart and new oceanic crust forms.
Comparing Boundary Types
Each boundary type has a characteristic motion, set of landforms, and hazard pattern. At a divergent boundary, plates separate, magma rises, and new crust forms. These boundaries commonly produce volcanic eruptions and shallow earthquakes, as at Iceland on the Mid-Atlantic Ridge. At an oceanic-continental convergent boundary, the denser oceanic plate subducts beneath the continent. This motion creates a trench, a volcanic mountain chain, and earthquakes ranging from shallow to deep. At a transform boundary, crust is neither created nor destroyed because plates slide past each other. Stress can build along a locked fault and then be released suddenly as an earthquake. Boundary categories describe overall motion, but local conditions affect hazard strength and frequency. Comparing evidence in a table or cross section helps students translate technical information into a visual model and connect plate motion with observable geologic events.

Explaining Hazard Locations
Hazard maps help explain why some communities face greater earthquake, volcanic, or tsunami risk than others. Japan lies near several convergent plate boundaries, where subduction produces frequent earthquakes, volcanic eruptions, and possible tsunamis. A large undersea earthquake can suddenly lift or lower the seafloor, displacing water and sending tsunami waves across the ocean. California faces major earthquake risk along the transform San Andreas Fault, but it has fewer volcanoes near that fault because transform motion does not usually generate magma. Location alone does not determine disaster severity. Population density, building design, warning systems, transportation networks, and emergency planning affect how strongly people and economies are harmed. Scientists combine plate maps, earthquake records, elevation data, and population maps to identify exposed areas. These geographic representations support safer building codes, evacuation routes, land-use decisions, and public education.
