
Predicting Motion from Patterns
Students observe and measure repeated motions, organize their data, and use patterns to predict how an object will move next.
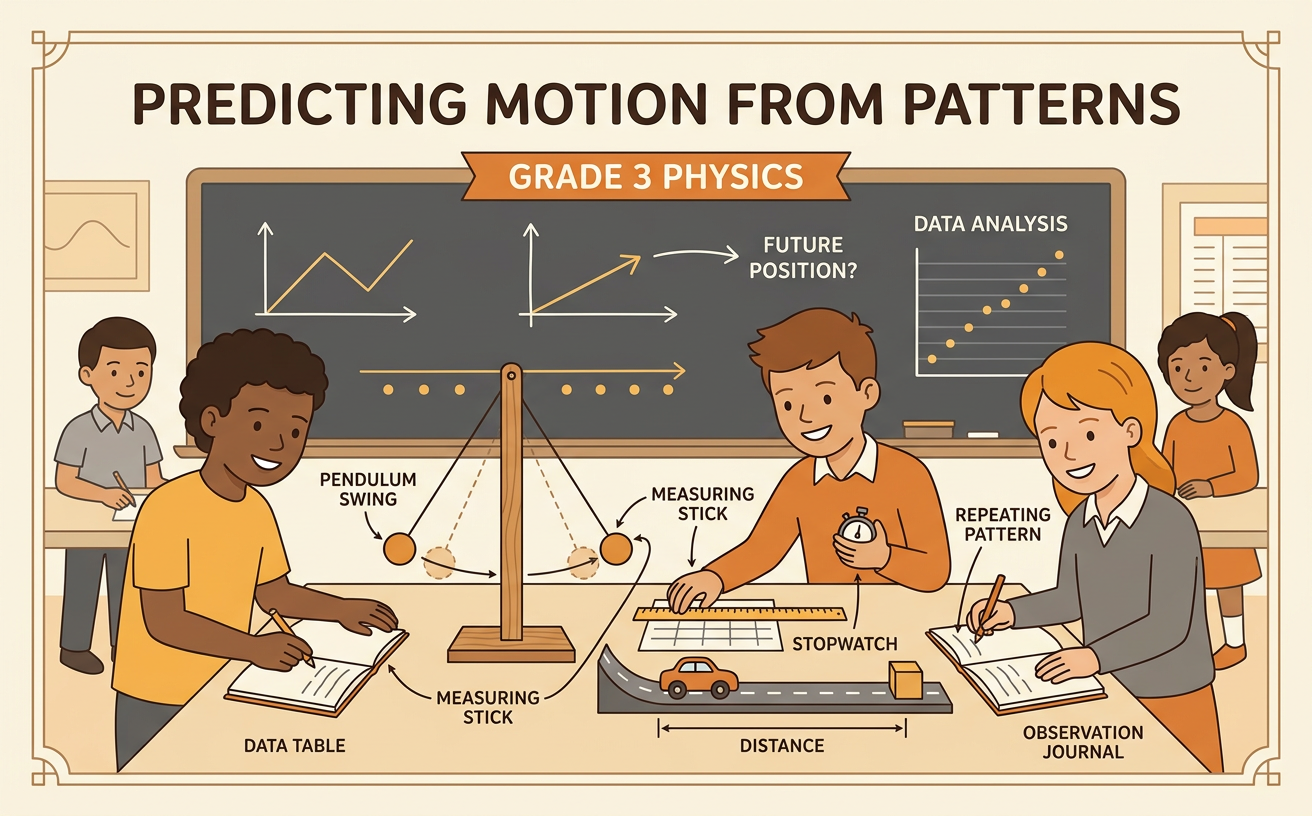
Illustrations are auto-generated and may be placeholders. They can be refreshed to match the narration.
Observe Repeating Motion
Motion describes a change in an object’s position. Some motions repeat in a recognizable way. For example, when a rubber ball is dropped, it moves down, touches the floor, and bounces up. It may repeat this down-and-up motion several times. Watch carefully before making a prediction. Notice the direction of motion, the highest point of each bounce, and the order of events. In one observation, a ball reached a lower height after every bounce. This repeating down-and-up motion had a changing pattern: each bounce was lower than the one before it. Several observations are more useful than one observation because they help show whether the pattern continues.

Measure Distance and Time
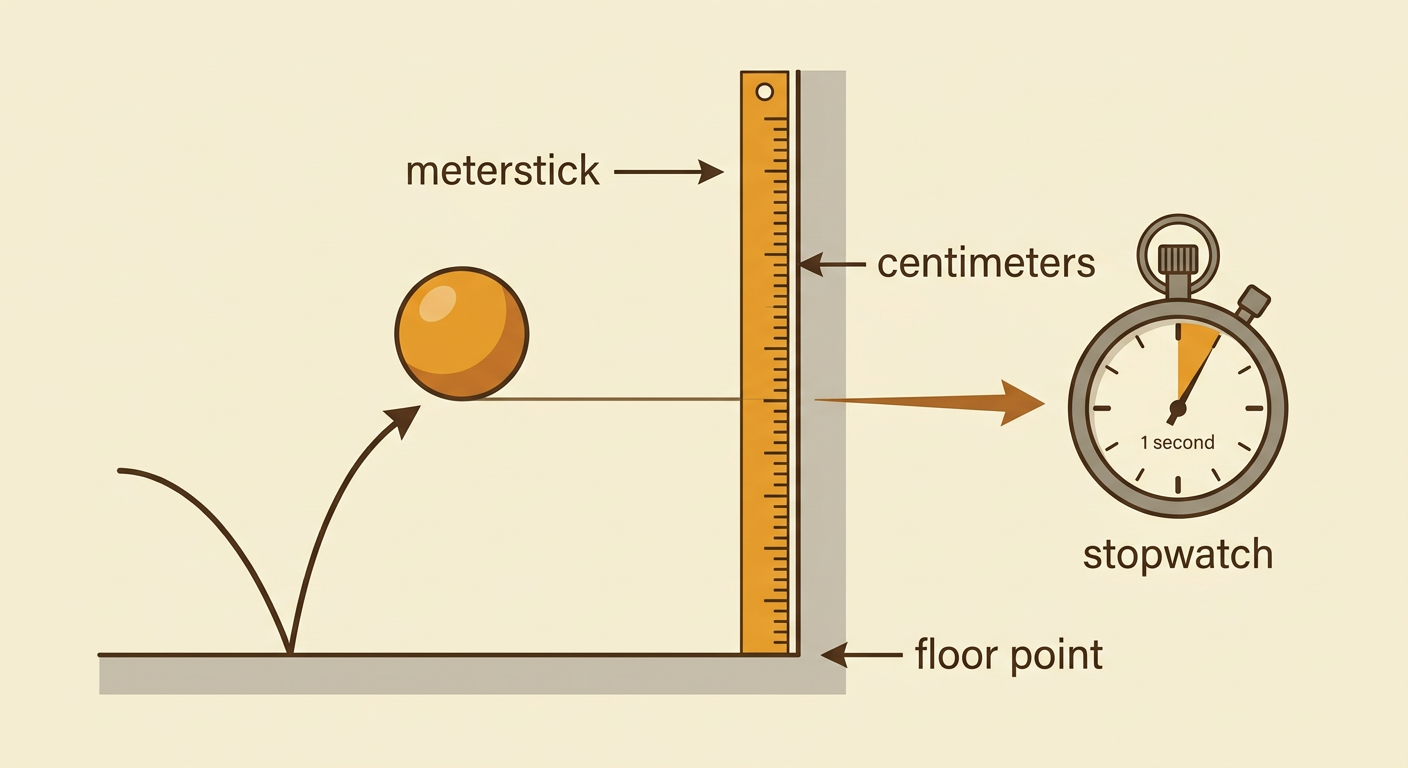
Measurements give exact information about motion. Distance tells how far an object moves or how high it reaches. Time tells how long the motion takes. To measure a bouncing ball, place a meterstick upright beside a wall and record the ball’s greatest height after each bounce. Use centimeters for height. A stopwatch or video timer can show when each bounce occurs. Suppose the first bounce reaches 60 centimeters at 1 second, the second reaches 50 centimeters at 2 seconds, and the third reaches 40 centimeters at 3 seconds. Measure from the floor to the bottom of the ball at its highest point each time. Using the same method makes the measurements easier to compare.
Record Motion Data
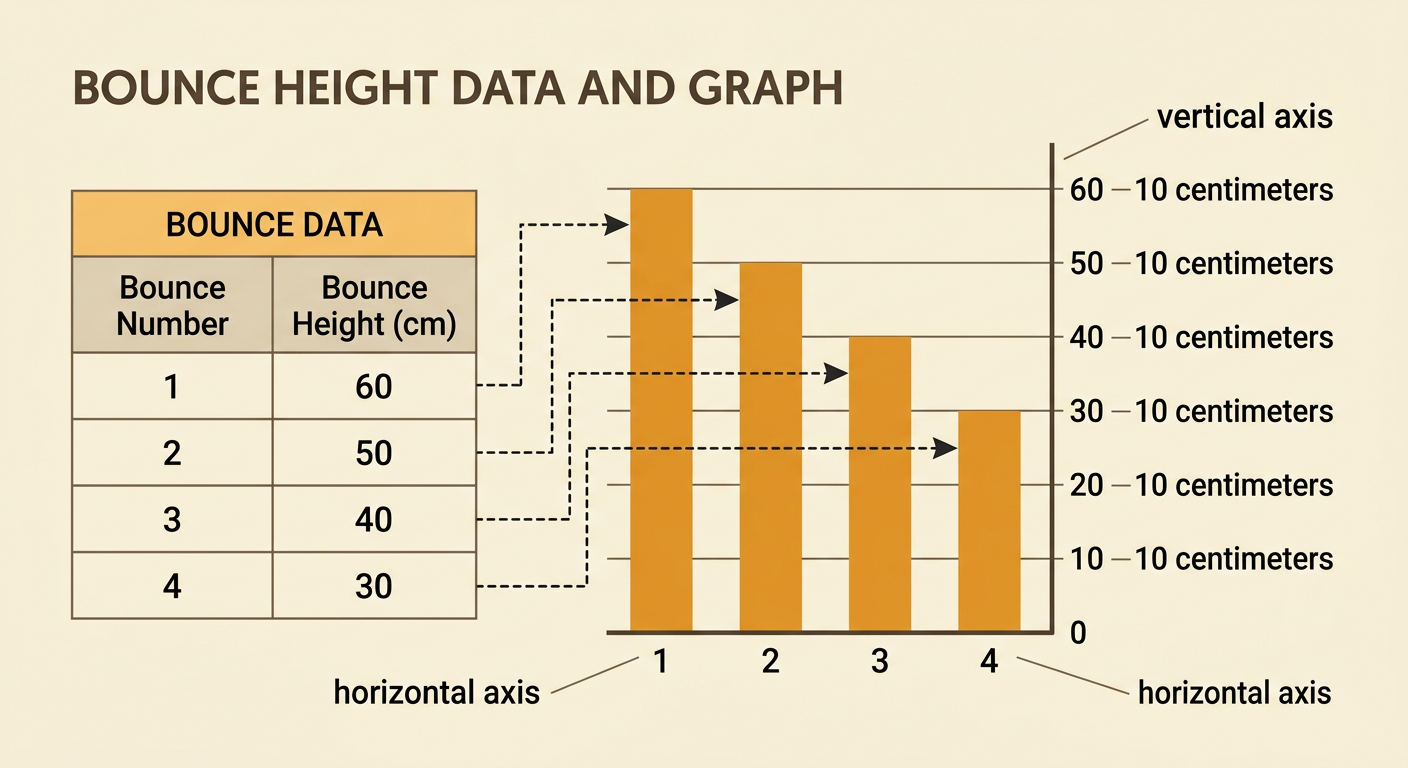
Organize measurements in a table so that the results are easy to read. One column can list the bounce number, and another can list the bounce height. Sample data might show 60 centimeters for bounce 1, 50 centimeters for bounce 2, 40 centimeters for bounce 3, and 30 centimeters for bounce 4. A scaled bar graph can display the same data. Put bounce numbers along the horizontal axis and height along the vertical axis. Use a scale in which each grid step represents 10 centimeters. The bars will have heights of 60, 50, 40, and 30 centimeters. The graph makes comparisons clear. For example, bounce 1 is 30 centimeters higher than bounce 4.
Find a Pattern
A pattern is something that repeats or changes according to a rule. Look across the bounce data in order: 60, 50, 40, and 30 centimeters. Compare each height with the height before it. From 60 to 50, the height decreases by 10 centimeters. The same change occurs from 50 to 40 and from 40 to 30. The pattern rule is “subtract 10 centimeters after each bounce.” The graph also shows this rule because each bar is one 10-centimeter grid step shorter than the bar before it. A pattern is stronger evidence when it appears in several measurements. Real bouncing balls may not decrease by exactly the same amount, so scientists check the measurements and describe the pattern the data actually show.

Predict What Happens Next
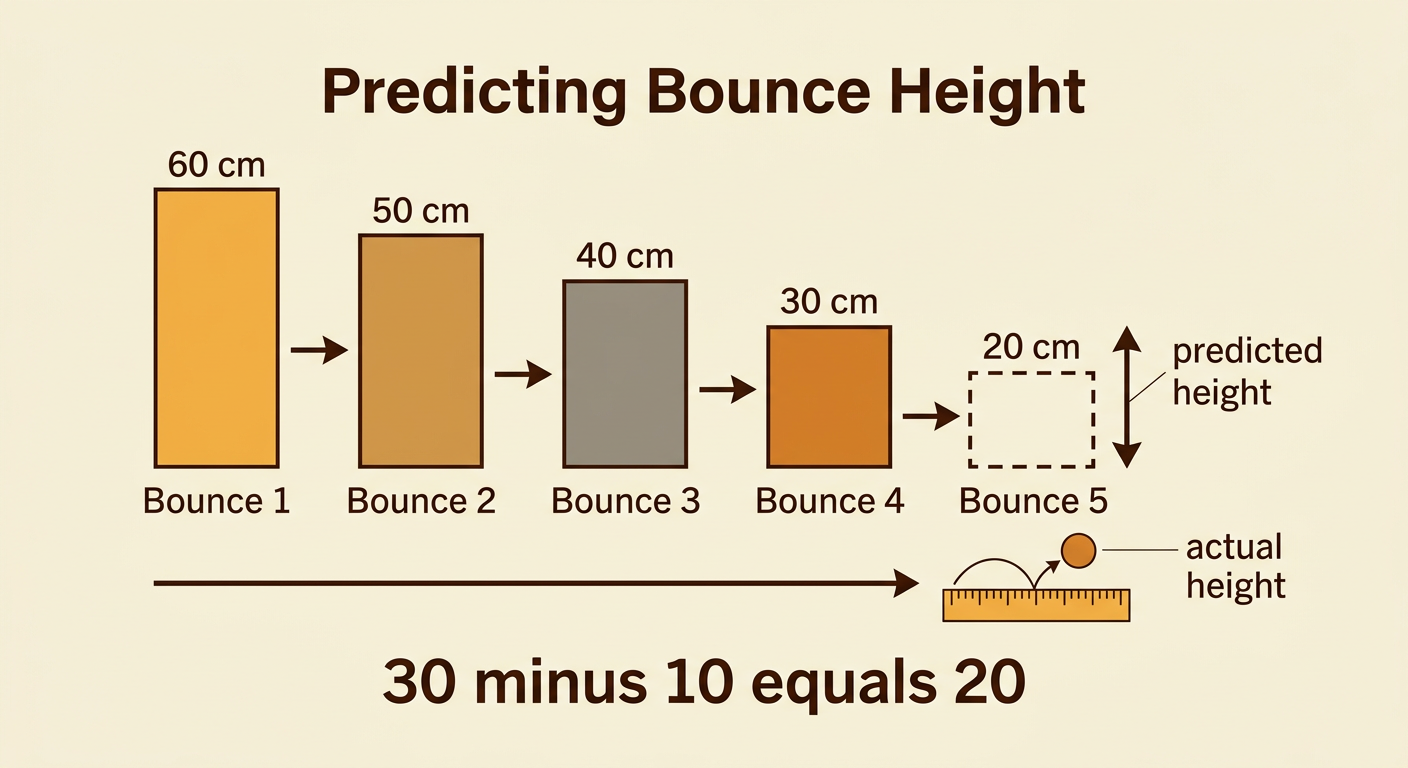
A prediction states what is likely to happen based on evidence. Use the pattern rule to predict the next bounce. The fourth bounce reached 30 centimeters, and the observed rule says to subtract 10 centimeters. Therefore, 30 minus 10 equals 20, so the predicted height of bounce 5 is 20 centimeters. This prediction comes from the measurements, not from a guess. Test it by dropping the ball in the same way and measuring the fifth bounce. If the ball reaches close to 20 centimeters, the result supports the prediction. If it does not, record the actual height and look again for a pattern. Predictions can change when new evidence shows that the motion has changed.
Explain with Evidence
A strong explanation includes a claim, evidence, and reasoning. The claim tells what you predict. The evidence gives measurements or facts from the investigation. The reasoning explains how the evidence supports the claim. For example: “I predict that the fifth bounce will reach 20 centimeters. The first four bounce heights were 60, 50, 40, and 30 centimeters. Each bounce was 10 centimeters lower than the one before it. Subtracting 10 centimeters from 30 centimeters gives 20 centimeters.” This explanation presents the events in order and uses data instead of opinion. After testing, add the measured fifth-bounce height. Then explain whether the new evidence supports the prediction or suggests that the pattern needs to be changed.
