
Program a Class Poll Counter
Students use events and variables in a block-based program to collect votes on a classroom improvement and display the results as a bar graph.
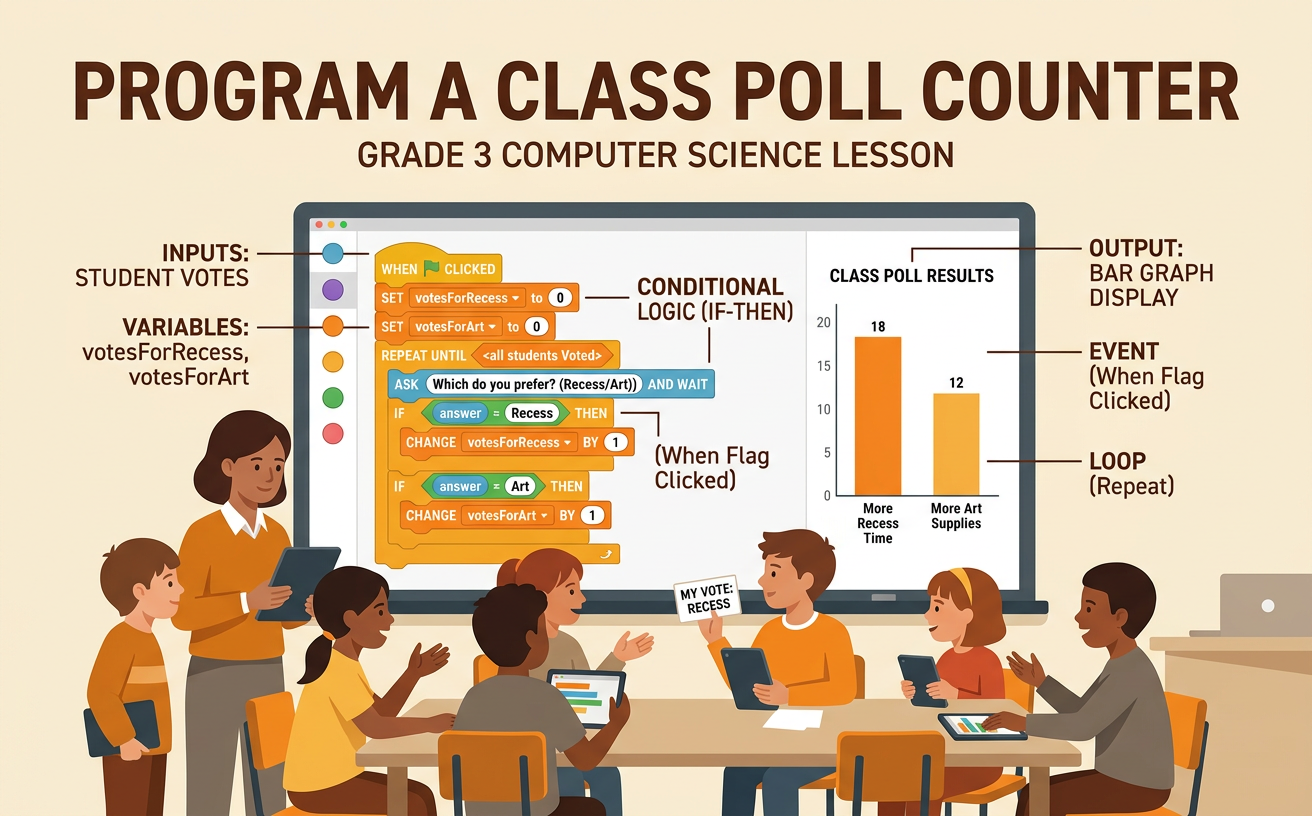
Illustrations are auto-generated and may be placeholders. They can be refreshed to match the narration.
Introduce the Class Decision
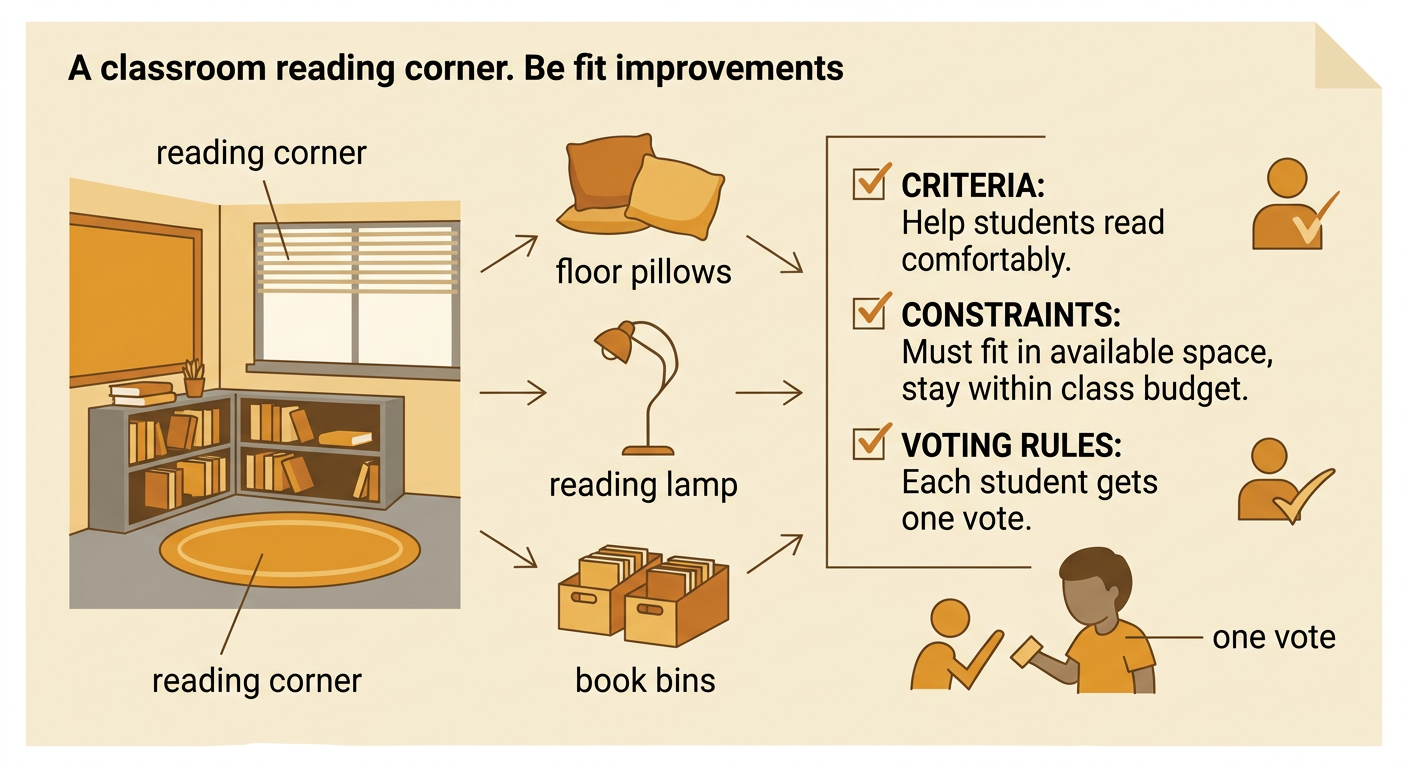
A class poll lets everyone help make a shared decision. Begin with a simple design problem: How can we improve our classroom reading corner? Possible choices might be floor pillows, a reading lamp, or new book bins. Set clear criteria and constraints before voting. The improvement should help students read comfortably, fit in the available space, and stay within the class budget. The poll must offer the same choices to everyone, and each student may vote only once. Responsible participation means thinking carefully, following the rules, and respecting the final result even if another choice wins. Explain that the class will build a program to collect votes fairly, count them correctly, and show the results in a graph.
Plan Buttons and Vote Variables
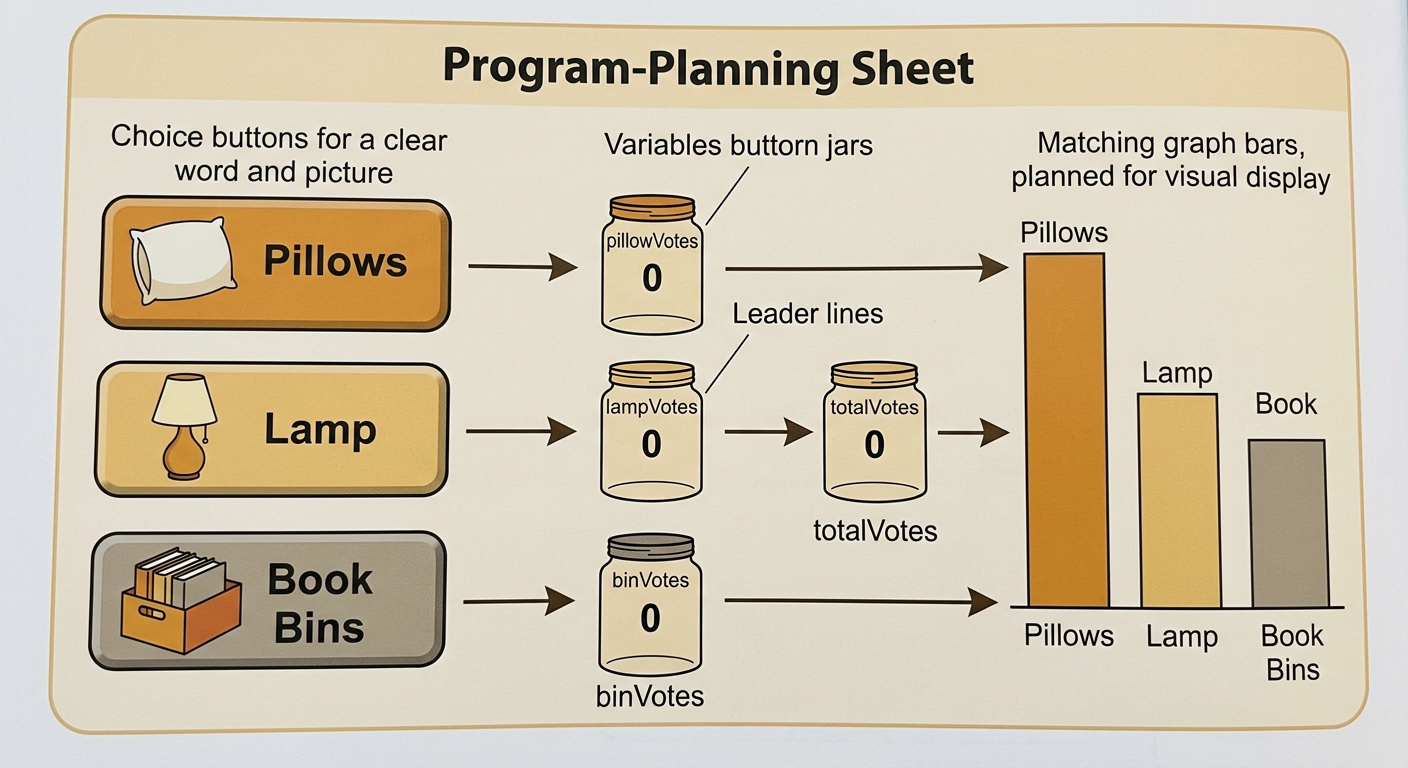
Plan the program before placing any blocks. Make one large button for each choice: Pillows, Lamp, and Book Bins. Each button should have a clear word and picture so voters know what it means. Next, create a variable for each choice. A variable is a named place where the program stores a number. Name the variables pillowVotes, lampVotes, and binVotes. Set every vote variable to 0 when the program starts. You can also create totalVotes to track how many students have voted. For example, if three students select Pillows, pillowVotes should contain 3. Plan a bar for each choice so the stored numbers can later control the bar heights. Keep the button colors consistent with the matching graph bars.
Code Click Events
An event tells the program when to run a set of instructions. Use a “when this sprite clicked” event for each voting button. Under the Pillows event, add blocks that change pillowVotes by 1 and change totalVotes by 1. Then update the number shown beside the Pillows bar. Build matching event stacks for Lamp and Book Bins, changing only the correct vote variable. For example, if lampVotes is 4 and a student clicks Lamp, the event changes lampVotes to 5. It should not change pillowVotes or binVotes. To support one vote per student, the program can lock all three buttons after a choice is clicked. The teacher can select a Next Voter control to unlock the buttons for the next student.

Test and Debug the Counter
Testing helps you find mistakes before the real poll. First, reset all variables to 0. Use a short test sequence: click Pillows, click Lamp, and click Pillows again, using Next Voter between clicks. The expected results are pillowVotes = 2, lampVotes = 1, binVotes = 0, and totalVotes = 3. Compare the expected numbers with the numbers displayed by the program. If clicking Lamp increases binVotes, the Lamp event is connected to the wrong variable. Replace that block with “change lampVotes by 1.” Also test the voting lock by trying to click two choices during one turn. The second click should not count. After every fix, reset and repeat the same test so you can confirm that the program now works correctly.

Graph and Compare Results
After everyone votes, use the variables to make a scaled bar graph. Give the graph a title, label each choice, and include a numbered scale. Suppose the class records 12 votes for Pillows, 8 for Lamp, and 4 for Book Bins. If one graph unit represents 2 votes, the bars should be 6, 4, and 2 units tall. Check that 12 + 8 + 4 = 24, the number of participating students. Then compare the results. Pillows received the most votes, and Book Bins received the fewest. Pillows received 4 more votes than Lamp because 12 − 8 = 4. The graph helps the class explain its decision with evidence. Responsible participants accept the result, thank everyone for voting, and help carry out the winning improvement.
