
Program a Rainwater-Flow Simulation
Students create and test a grid-based program that uses conditional rules to simulate how rainwater moves downhill and around landform barriers.

Illustrations are auto-generated and may be placeholders. They can be refreshed to match the narration.
Trace Water on a Grid
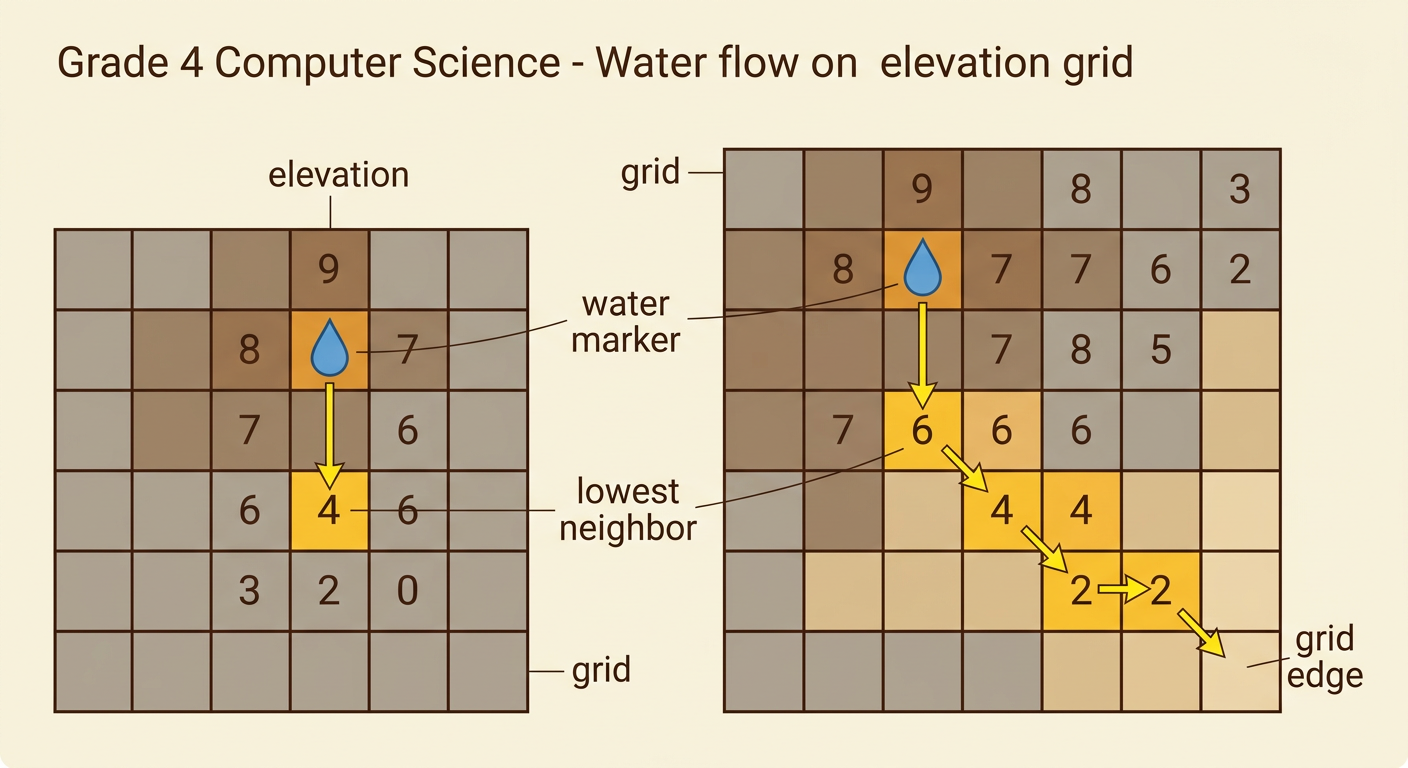
A grid can represent a small area of land. Each square stores an elevation number. A larger number means higher land, and a smaller number means lower land. Place a water marker on one square to show where a raindrop starts. Then compare that square with the squares directly north, south, east, and west. Trace the water into the neighboring square with the lowest elevation. For example, suppose water starts at elevation 8. Its neighbors have elevations 9, 7, 6, and 8. The water moves to elevation 6 because that is the steepest downhill step. Repeat the comparison from each new square until the water reaches the grid edge or cannot move lower. The traced path is a mathematical model of how location and land height can affect water flow.
Define Conditional Rules
A conditional rule tells the program what to do when a condition is true. Use if and then statements to control the water. One rule can say, “If a neighboring square is lower, then move to the lowest neighbor.” Another can say, “If every neighbor is the same height or higher, then stop.” Mark rocks or walls as barriers that water cannot enter. You also need a rule for equal low neighbors. For example, if both the east and south squares have elevation 4, the program could always choose east first. Using the same tie rule makes every run predictable. Suppose water is on elevation 5, with a rock to the east and elevation 3 to the south. The barrier rule blocks the east move, so the water moves south to elevation 3.

Build the Block Program
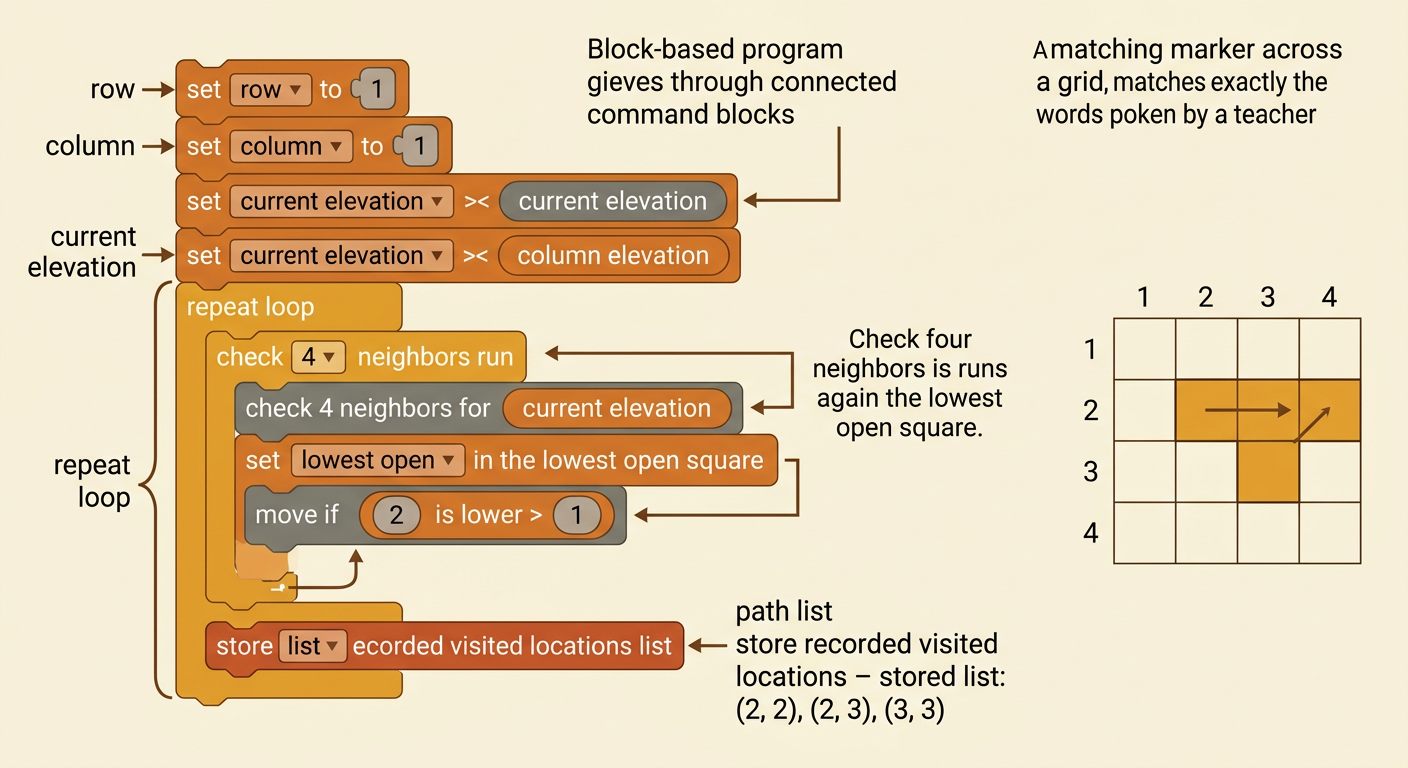
Build the simulation with blocks that repeat the conditional rules. Start by creating variables for the water’s row, column, and current elevation. Place the water marker at a chosen starting square. Inside a repeat loop, check the four neighboring squares and find the lowest open one. If that elevation is lower than the current elevation, change the row or column so the marker moves there. Add the new location to a path list. Otherwise, stop the loop. For example, moving east changes the column by 1 while the row stays the same. A path might record (2, 2), (2, 3), and (3, 3). Add a short pause after each move so students can watch the route. The coordinates and elevation comparisons turn the land map into instructions a computer can follow.
Test Different Landforms
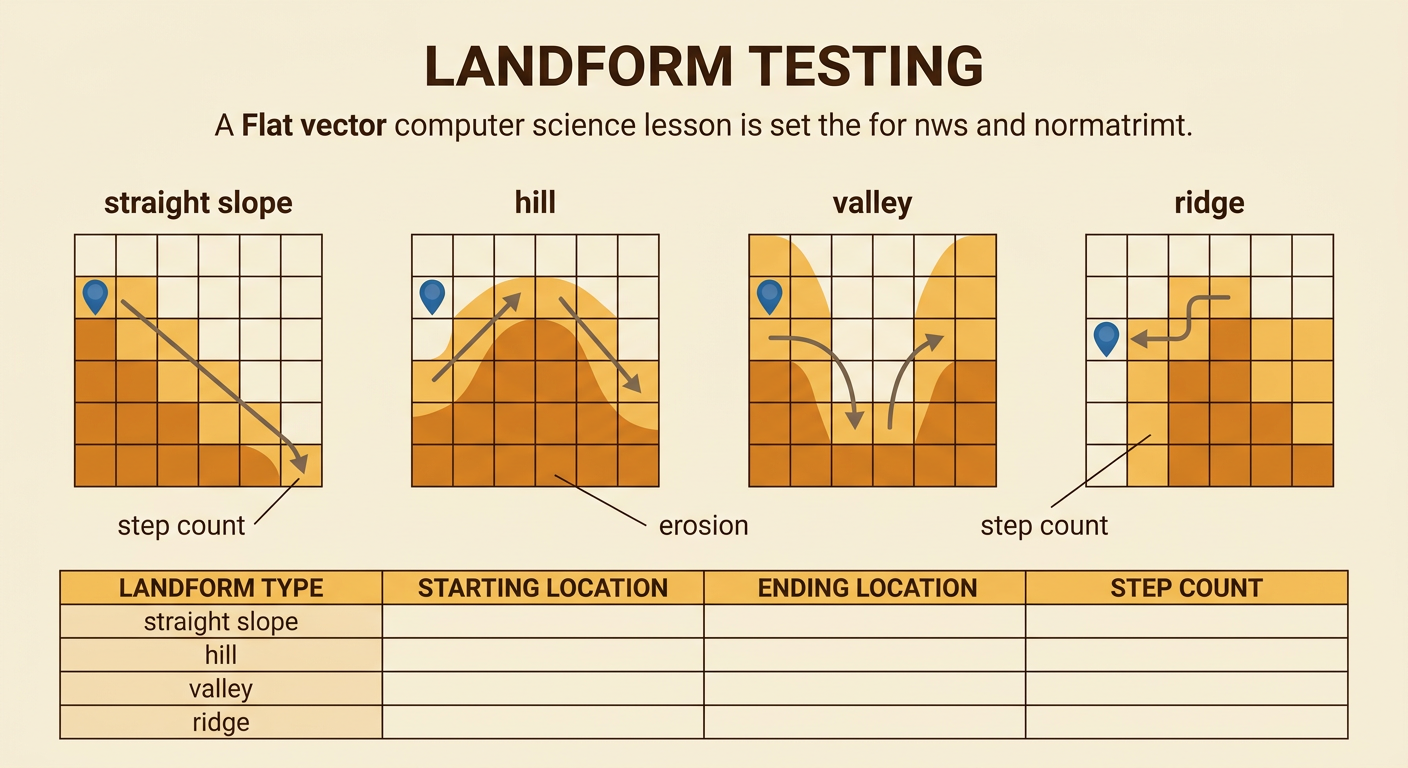
Test the same program on several landform grids to learn how terrain changes water flow. Try a straight slope, a hill with two downhill sides, a valley, and a ridge made of high cells. Keep the starting square and program rules the same so the landform is the only changed variable. Before each run, predict the path. Then record where the water moved, where it stopped, and how many steps it took. For example, on a smooth slope the marker might reach the bottom edge in six steps. On a grid with a ridge, it might turn west and reach the edge in nine steps. You can also mark path cells as places where moving water might cause more erosion. The model does not prove erosion occurred, but it helps identify locations where observations or measurements could be collected.
Explain and Revise the Model
Use the path data to explain how locations and land characteristics are related. State what happened and support the statement with evidence from the grid. For example, “The water turned west because the ridge cells to the south had elevations of 9, while the western cell had elevation 5.” Next, compare the simulation with real rainwater. Real water can spread, soak into soil, collect in puddles, and carry sediment. A single marker does not show all these actions, so the program is a simplified model. Revise one rule to improve it. You might add a water-amount variable, allow water to collect in a low basin, or mark sediment moved after repeated flow. Run the revised program on the same map and compare both paths. Explain whether the change made the model more useful and what limitation still remains.
