
Program an Interactive Coordinate Map
Students use coordinate pairs and event-based commands to program and test an interactive map that displays information when selected locations are clicked.

Illustrations are auto-generated and may be placeholders. They can be refreshed to match the narration.
Explore Coordinates on a Digital Map
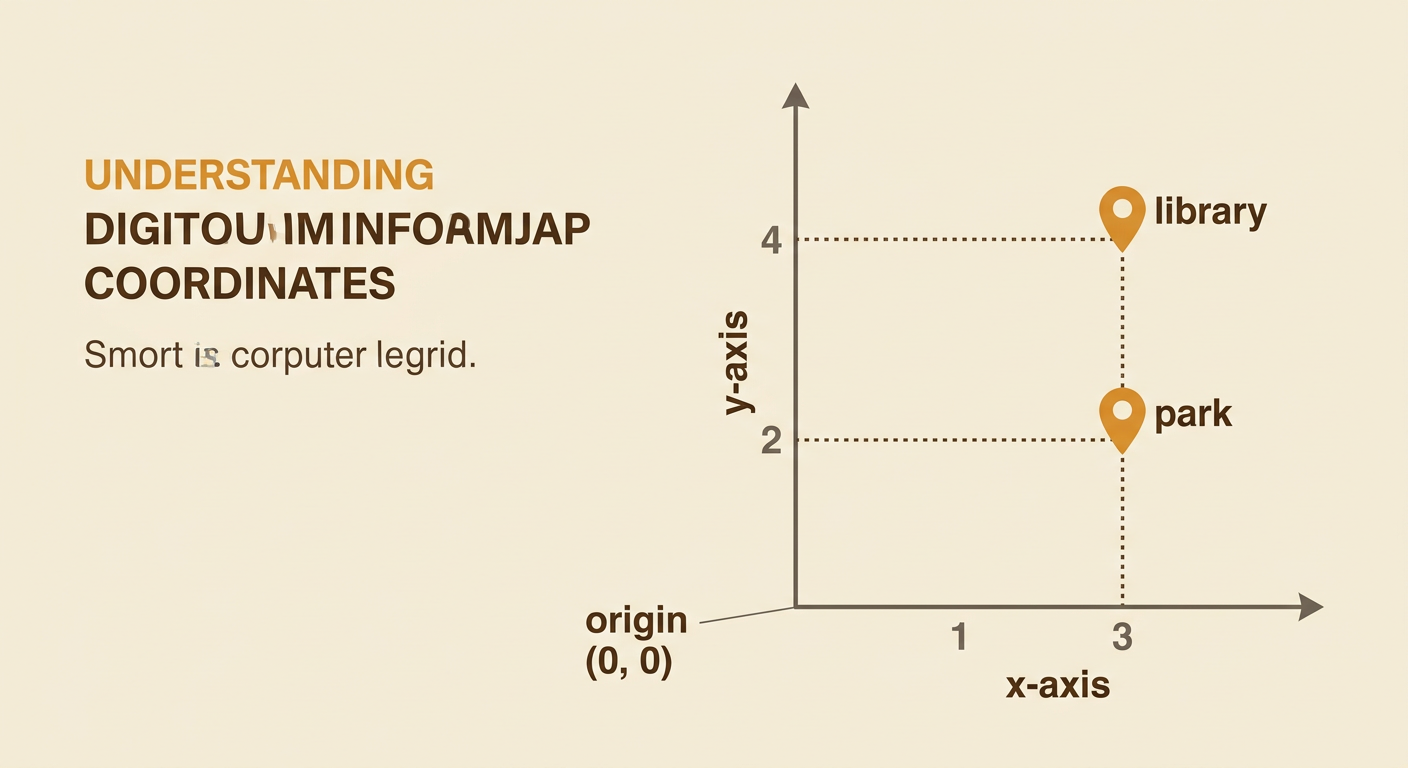
A digital map can use a coordinate plane to give every location an exact address. The horizontal x-axis and vertical y-axis are perpendicular, which means they meet at a right angle at the origin, (0, 0). Coordinates are written as (x, y). Start at the origin, move right along the x-axis, and then move up parallel to the y-axis. For example, a library at (3, 4) is 3 units to the right and 4 units up. Do not switch the numbers, because (4, 3) names a different point. A grid can also show relationships among places. A park at (3, 2) is directly below the library because both locations have the same x-coordinate.
Choose Locations and Map Information
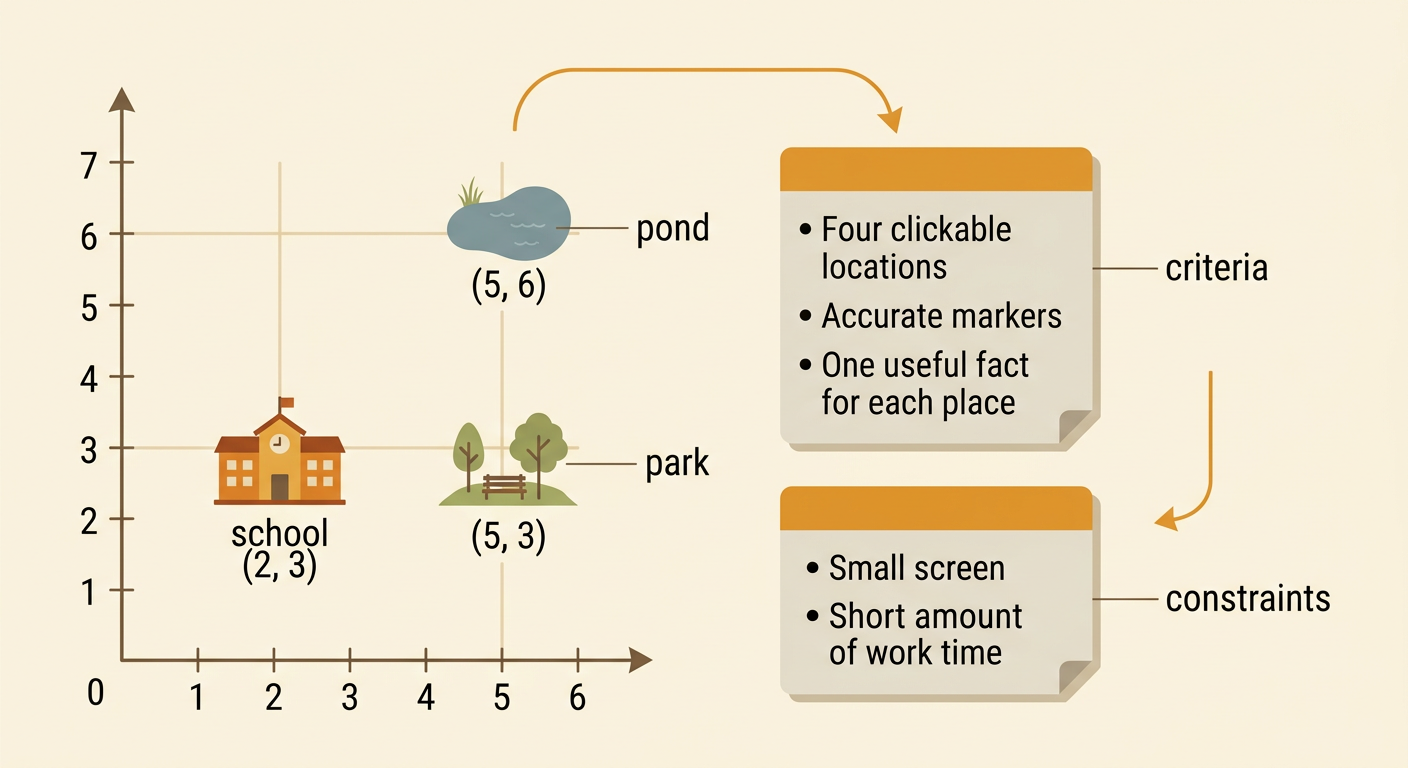
Before programming, decide what the map should show and what users should learn. Create criteria, or goals, such as including four clickable locations, placing every marker accurately, and showing one useful fact for each place. Also identify constraints, such as a small screen or limited time. For example, a neighborhood map might include a school at (2, 3), a park at (5, 3), and a pond at (5, 6). The shared y-coordinate shows that the school and park are on the same horizontal line. The park and pond share an x-coordinate, so the pond is directly north of the park on this map. Compare marker and information-card designs. Choose the solution that is easiest to read while still meeting the criteria and constraints.
Program Click Events
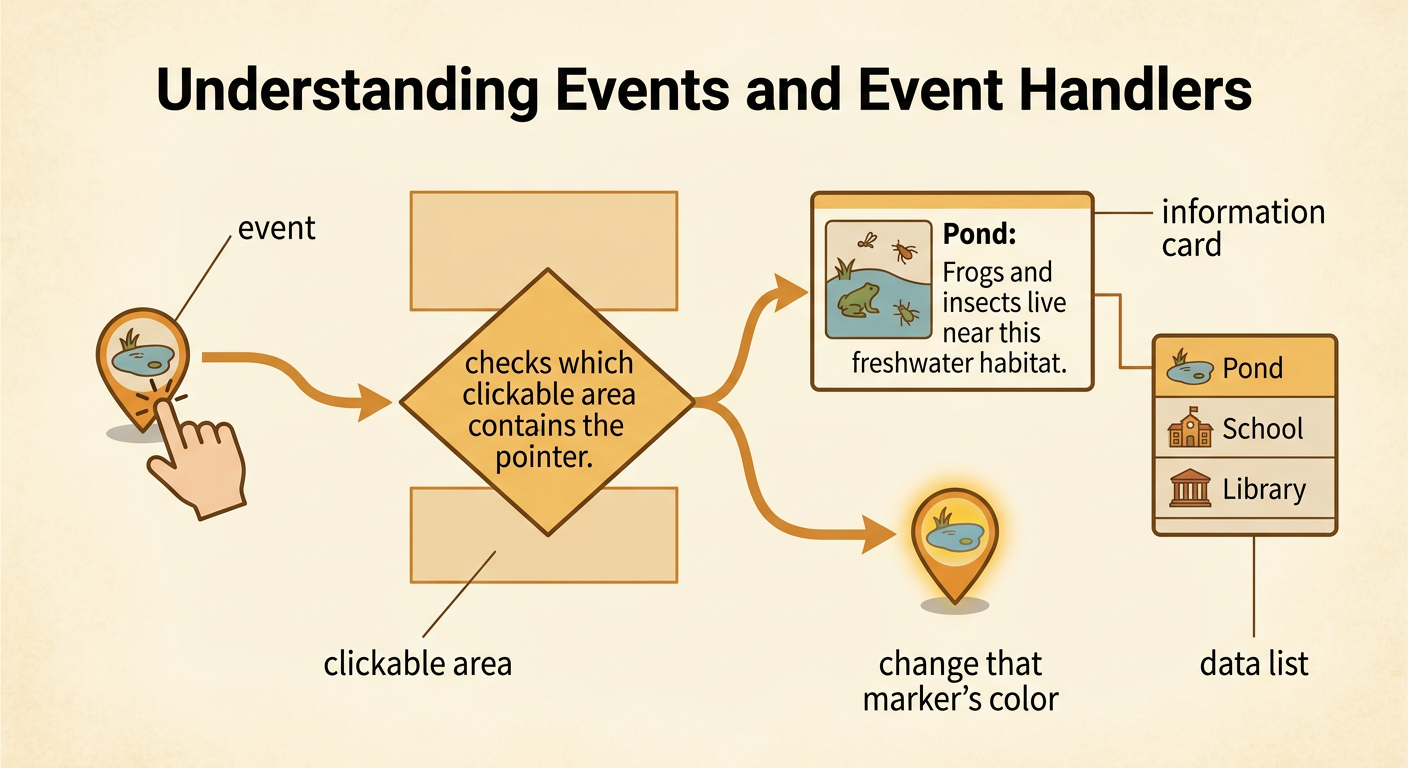
An event is an action that a program can detect, such as a mouse click or screen tap. An event handler tells the program what to do when that action happens. For each map marker, connect a click event to the correct information card. For example, when the user clicks the marker at (5, 6), the program can display, “Pond: Frogs and insects live near this freshwater habitat.” Give each marker a small clickable area so users do not have to select one exact pixel. The program should check which area contains the pointer and then show only that location’s information. It can also change the marker’s color to confirm the selection. Keeping coordinates, names, and facts together in a data list makes the program easier to update.
Test Coordinate Accuracy
Testing helps determine whether markers and click areas match the intended coordinates. First, compare each marker with its planned coordinate pair. Then click the center and edges of every marker and record what happens. For example, suppose the museum should be at (6, 2), but it appears at (2, 6). The programmer probably reversed the x- and y-values. Move 6 units right and 2 units up to place it correctly. Also check that grid intervals are equal and that the program uses the same origin and scale as the displayed map. Test geographic relationships too. If a café and museum share a y-coordinate, they should appear on the same horizontal line. A checklist with expected and actual results provides evidence about which parts work and which parts need correction.

Debug and Improve the Map
Debugging means finding the cause of a problem, changing the program, and testing again. Fix one issue at a time so you can tell which change helped. For example, two nearby markers may have overlapping clickable areas. Clicking the fire station might then open the hospital card. Possible solutions include making both click areas smaller, moving the markers if their coordinates were wrong, or programming the closest marker to respond. Compare these solutions with the map’s criteria and constraints. Smaller areas may prevent overlap but can be harder to tap on a tablet. After choosing a solution, test each marker several times and ask a classmate to try the map. Use the test results to improve labels, colors, instructions, and information cards until the map is accurate, clear, and easy to use.
