
Protecting Pollinators: Comparing Solutions for Biodiversity
Students analyze pollinator and crop-yield evidence to compare proposed solutions for maintaining biodiversity and ecosystem services.

Illustrations are auto-generated and may be placeholders. They can be refreshed to match the narration.
Why Pollinators Matter
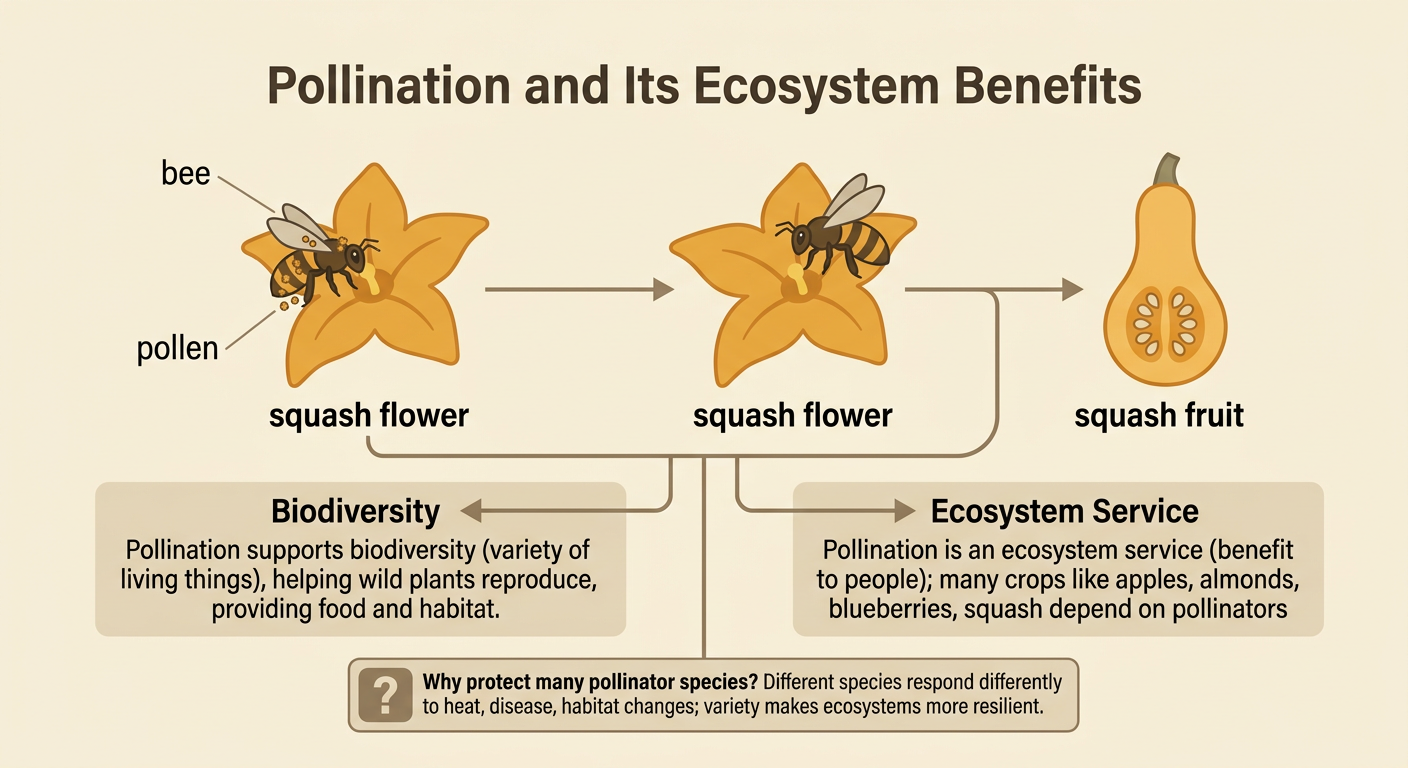
Pollinators move pollen between flower parts, allowing many flowering plants to produce seeds and fruits. Bees, butterflies, moths, beetles, birds, and bats can all serve as pollinators. This process supports biodiversity because it helps wild plants reproduce and provide food and habitat for other organisms. Pollination is also an ecosystem service, meaning a benefit people receive from nature. Many crops, including apples, almonds, blueberries, and squash, depend partly or greatly on animal pollination. For example, when a bee visits a squash flower for nectar, pollen may stick to its body and reach another flower. Successful pollination can then lead to a squash fruit. Not every crop needs animal pollinators, but protecting a variety of pollinator species makes food systems and ecosystems more resilient when conditions change.
Threats to Pollinator Biodiversity
Pollinator biodiversity can decline when several environmental pressures occur together. Habitat loss removes nesting sites and flowering plants. Pesticide exposure may kill pollinators or interfere with their movement and reproduction. Diseases, invasive species, and climate change can add further stress. For example, replacing a meadow with pavement eliminates flowers and underground nesting spaces used by native bees. Long-term warming may also cause flowers to bloom before their usual pollinators become active. These human-caused changes affect places differently. Farming communities may cooperate to restore habitat, but they may also disagree over land use, pesticide rules, costs, or access to water. A useful analysis identifies where each threat occurs, how long it lasts, and which species are affected. A single observation cannot explain a decline, so scientists combine population surveys, land-use maps, climate records, and chemical tests.

Reading Pollinator and Crop Data
A scatter plot can help scientists examine the relationship between pollinator activity and crop yield. Each point represents one field measured for two variables. The horizontal axis might show the number of bee visits to flowers per hour, while the vertical axis shows kilograms of blueberries produced per plot. Suppose fields with 5 visits average about 12 kilograms, while fields with 20 visits average about 28 kilograms. An upward pattern suggests a positive association: fields with more visits tend to have greater yields. A trend line summarizes the overall pattern, while points far from it are outliers that deserve investigation. The graph does not prove that bee visits alone caused the yield difference. Soil, rainfall, crop variety, and farm practices may also matter. Students should cite exact values, describe the direction and strength of the pattern, and connect the graph with written evidence before drawing conclusions.

Comparing Proposed Solutions
Competing solutions should be evaluated with the same criteria and constraints. One proposal might plant strips of native flowers along field edges. Another might reduce pesticide use through integrated pest management, which uses monitoring and targeted controls before broad chemical treatment. A third might protect larger connected habitats through conservation agreements. Flower strips can provide food quickly and use little cropland, but they require maintenance. Reduced pesticide use can lower pollinator exposure, but farmers need training and reliable pest-control options. Habitat protection can support many species over a large area, but it may cost more and require cooperation among landowners, governments, and community groups. Students can compare each solution by expected biodiversity benefit, crop benefit, cost, time, land needs, and possible unintended effects. Strong comparisons use evidence rather than assuming that the most visible or least expensive option is automatically best.

Evidence-Based Recommendation
An evidence-based recommendation states a preferred solution, supports it with specific evidence, and acknowledges trade-offs. Imagine that a three-year study found native flower strips increased wild bee visits from 8 to 15 per hour, while nearby blueberry yield rose from 18 to 25 kilograms per plot. The study also reported moderate installation costs and no measurable loss of crop area because strips were planted along field edges. A reasonable recommendation would be to install native flower strips while continuing to monitor bee diversity and yield. The claim is stronger when it cites those exact results and explains that the scatter plot shows a positive association. It should also note limitations: three years may not reveal long-term effects, and results from one region may not apply everywhere. Combining flower strips with carefully managed pesticide reduction may provide broader protection if farmers, scientists, landowners, and local governments share responsibilities and review new data.
