Radioactive Decay and Nuclear Energy Decisions
Students model radioactive decay, distinguish fission from fusion, and use scientific evidence to evaluate a nuclear energy policy claim.
Illustrations are auto-generated and may be placeholders. They can be refreshed to match the narration.
Inside the Atomic Nucleus
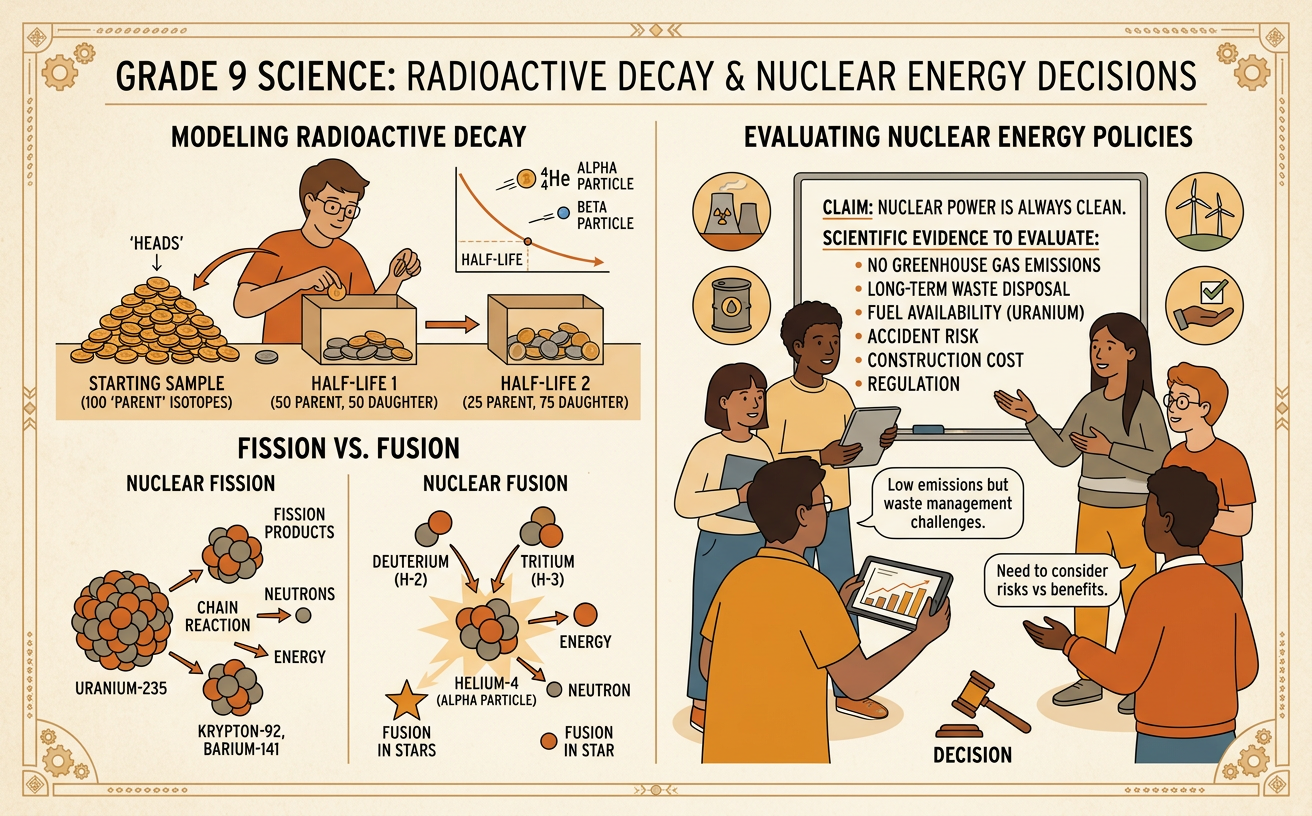
An atom’s nucleus contains positively charged protons and neutral neutrons. The number of protons identifies the element, while atoms of the same element can have different numbers of neutrons. These forms are called isotopes. Some combinations of protons and neutrons are unstable and change through radioactive decay, releasing particles and energy. For example, carbon-14 has six protons and eight neutrons. During beta decay, one neutron changes into a proton, producing nitrogen-14, an electron, and an antineutrino. The nucleus now has seven protons and seven neutrons, so its identity has changed from carbon to nitrogen. The total electric charge, energy, and number of nucleons are conserved when all products are included. Nuclear changes release energy because the products have a different nuclear binding energy than the original nucleus.

Modeling Radioactive Decay
Radioactive decay is random for an individual unstable nucleus, but a large group follows a predictable pattern. A half-life is the time required for half of the unstable nuclei in a sample to decay. Students can model this process with 100 coins: each coin represents one radioactive nucleus, and each toss represents one equal time interval. Remove every coin that lands tails, then toss the remaining coins again. About 50 coins should remain after one toss, 25 after two tosses, and 12 or 13 after three tosses. Actual results vary because each coin toss is random. The model demonstrates why scientists cannot predict exactly when one nucleus will decay but can predict the behavior of a large sample. Coins do not release particles or energy, so the model represents probability rather than every feature of real decay.

Recognizing Exponential Change
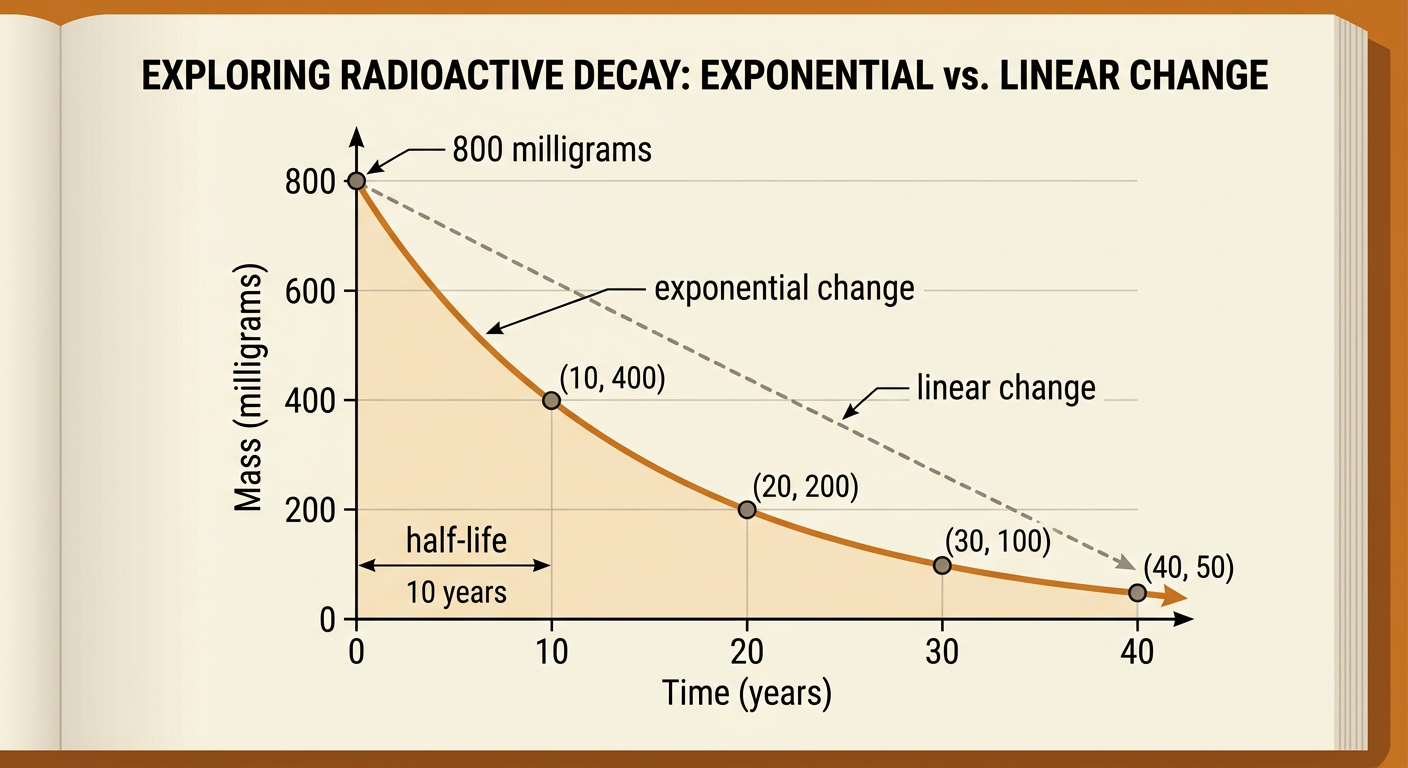
Radioactive decay is exponential rather than linear. In linear change, the same amount is added or subtracted during each equal interval. In exponential change, the quantity is repeatedly multiplied by the same factor. If an isotope has a half-life of 10 years and begins with 800 milligrams, the amounts after 10, 20, 30, and 40 years are 400, 200, 100, and 50 milligrams. The differences are not constant, but the ratio is always one-half. This pattern can be modeled by A equals 800 times one-half raised to the power t divided by 10, where t is measured in years. A straight graph would incorrectly predict that the sample reaches zero after a fixed time. The exponential graph curves toward zero because each interval removes half of what remains, not half of the original amount.
Comparing Fission and Fusion
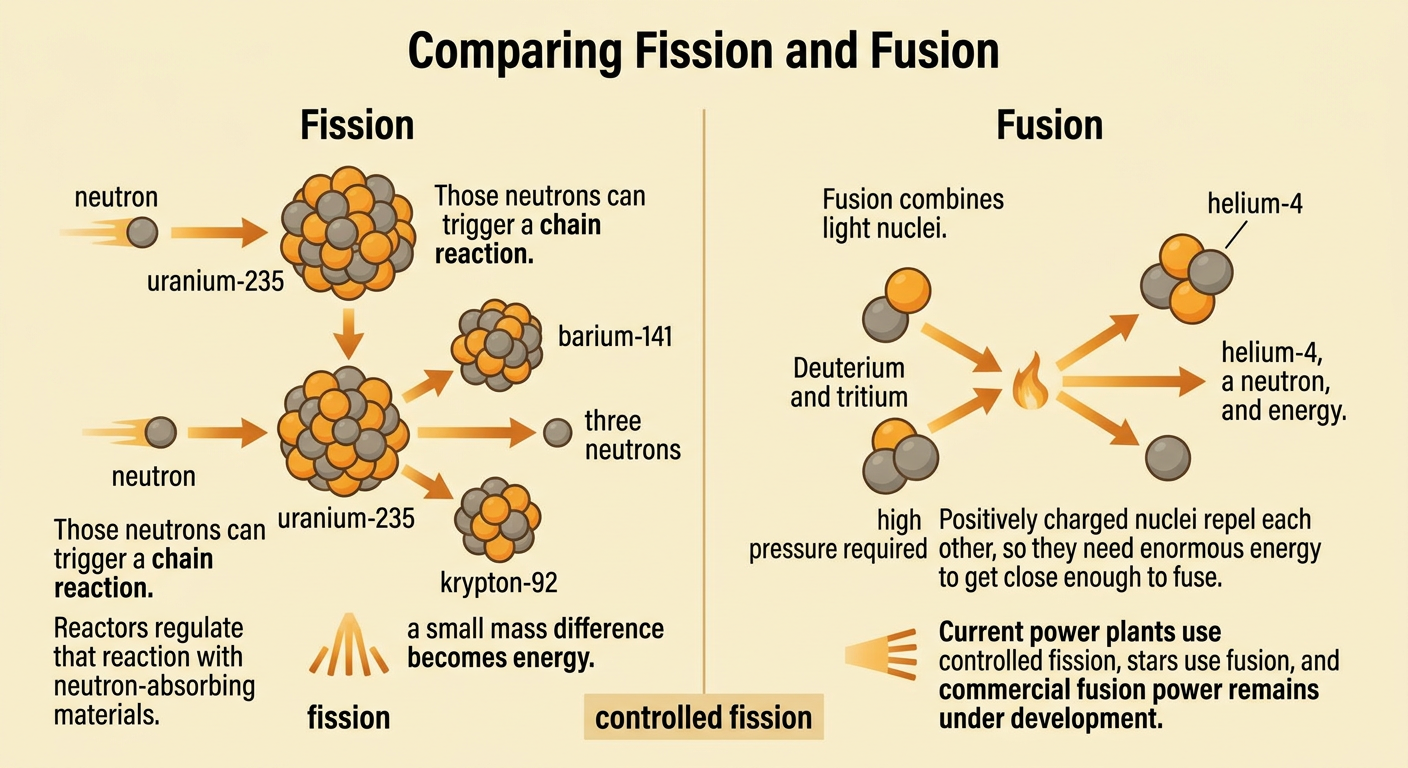
Fission and fusion both change atomic nuclei and release energy, but they work differently. In fission, a heavy nucleus splits into smaller nuclei. For example, uranium-235 can absorb a neutron and split into barium-141, krypton-92, three neutrons, and energy. The released neutrons may cause more fissions, creating a chain reaction that reactors control with neutron-absorbing materials. In fusion, light nuclei combine. A deuterium nucleus and a tritium nucleus can fuse to form helium-4, a neutron, and energy. Fusion requires extremely high temperature and pressure because positively charged nuclei repel one another. In both processes, the products have slightly less mass than the starting particles. That mass difference is converted to energy. Current nuclear power plants use controlled fission, while stars are powered mainly by fusion. Commercial fusion power is still under development.
Evaluating Nuclear Energy Evidence
A policy claim should be judged by the quality and relevance of its evidence, not by how confidently it is stated. Consider the claim, “Building a nuclear plant will provide reliable low-carbon electricity.” Evidence about operating time, electricity output, life-cycle greenhouse gas emissions, construction cost, waste storage, and accident risk is relevant. For example, a 1,000-megawatt plant operating at a 90 percent capacity factor would generate about 7.9 million megawatt-hours in one year. That calculation supports the reliability part of the claim, but it does not prove that the plant will be affordable or completed on schedule. Students should check who produced each source, how data were collected, whether comparisons use the same units and time periods, and whether uncertainty is reported. Evidence from independent studies and public agencies generally deserves more weight than an unsupported advertisement, although every source’s methods should still be examined.

Evidence-Based Policy Conclusion
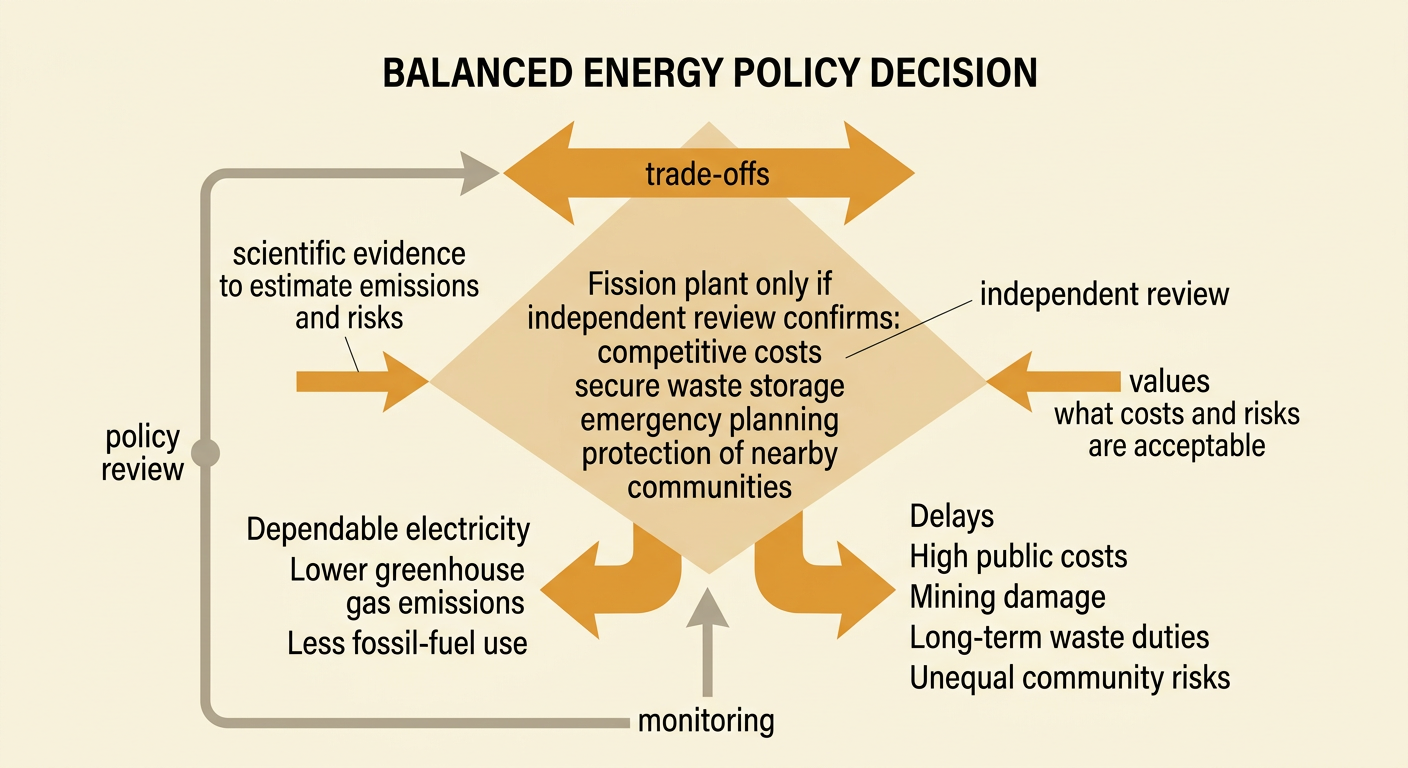
An evidence-based policy conclusion combines a clear position with scientific evidence, reasoning, and attention to consequences. A student might conclude, “Support a new fission plant only if independent review confirms competitive costs, secure waste storage, emergency planning, and protection of nearby communities.” The intended outcomes could include dependable electricity, lower greenhouse gas emissions, and reduced fossil-fuel use. Possible unintended outcomes include construction delays, high public costs, long-term waste responsibilities, environmental damage from fuel mining, or unequal risks for certain communities. The conclusion should explain trade-offs rather than pretending that one energy source has no disadvantages. It should also distinguish evidence from values: scientific data can estimate emissions or risk, while citizens and officials decide what cost and level of risk are acceptable. Monitoring requirements and scheduled policy reviews allow leaders to respond when new evidence differs from earlier predictions.