
Rational Numbers on the Number Line
Students plot, compare, and order positive and negative rational numbers in mathematical and real-world contexts.
Illustrations are auto-generated and may be placeholders. They can be refreshed to match the narration.
Review Integers and Fractions
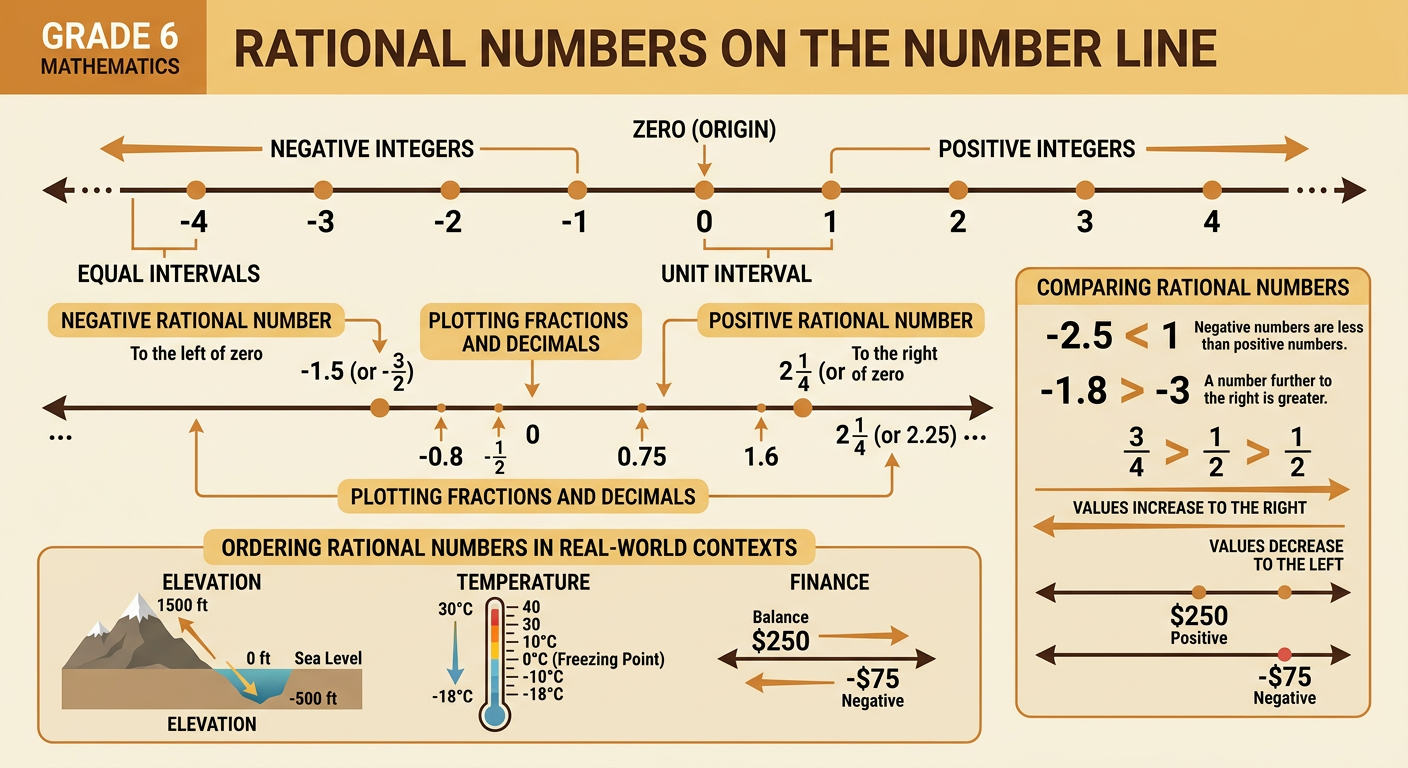
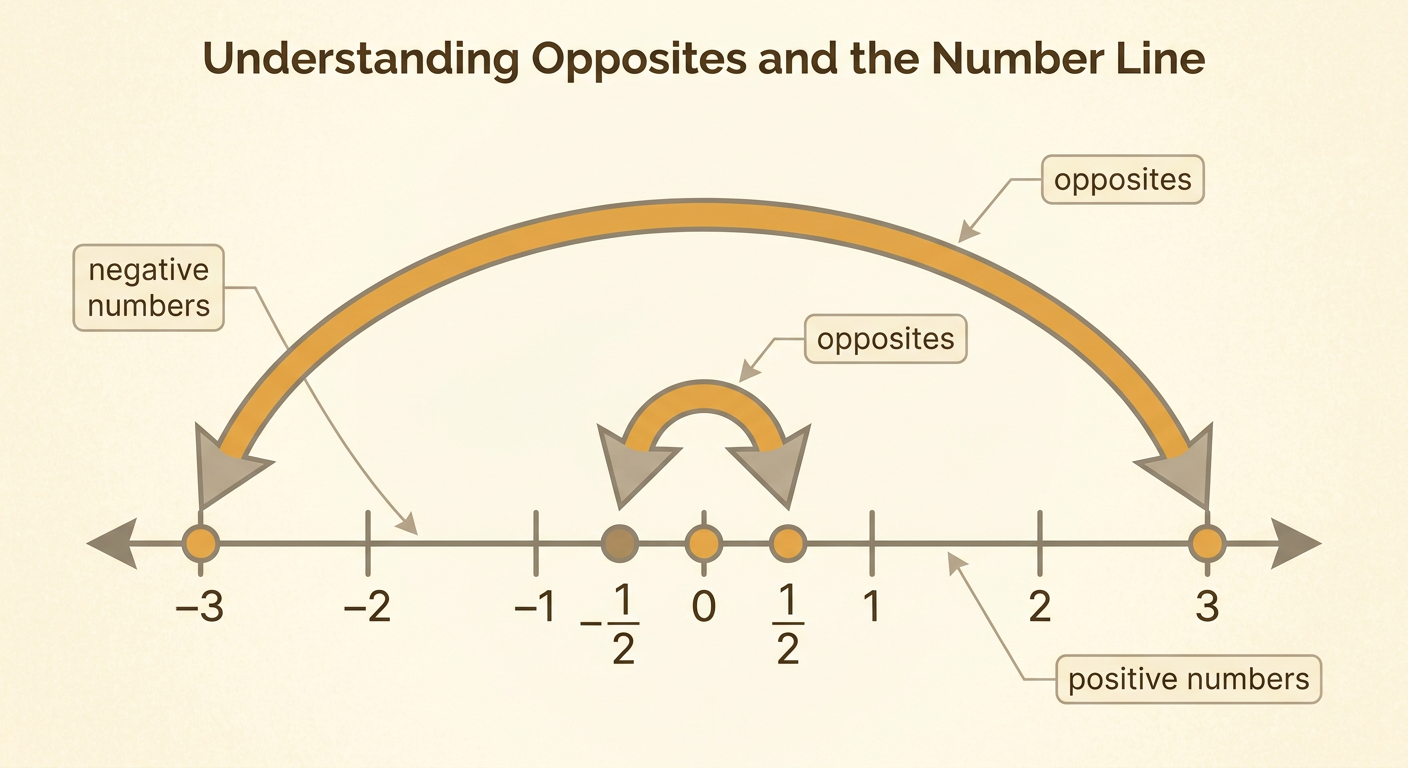
Rational numbers are numbers that can be written as a fraction of two integers, with a denominator that is not zero. They include positive and negative integers, fractions, decimals that end, and decimals that repeat. On a number line, positive numbers are to the right of 0, and negative numbers are to the left. A number and its opposite are the same distance from 0 but on different sides. For example, 3 and −3 are opposites. Similarly, 1/2 and −1/2 are opposites. Fractions can be located between integers. The number −1/2 lies halfway between −1 and 0, while 1/2 lies halfway between 0 and 1. Remember that numbers increase as you move from left to right along a number line.
Plot Rational Numbers
To plot a rational number, first locate the integers between which it belongs. Then divide that interval into equal parts based on the fraction’s denominator or the decimal’s place value. For example, to plot −1.5, find −1 and −2. Because −1.5 is halfway between them, place the point at the midpoint. To plot 3/4, divide the distance from 0 to 1 into four equal parts and place the point at the third tick to the right of 0. Negative values are plotted left of 0, while positive values are plotted right of 0. Check that the spacing is proportional: equal numerical differences must be shown by equal physical distances on the number line.
Compare Using Inequality Symbols
The symbols < and > show the order of two numbers. The symbol < means “is less than,” and > means “is greater than.” On a number line, the number farther to the right is always greater. For example, −3/4 is to the left of 1/4, so −3/4 < 1/4. When comparing two negative numbers, the number closer to 0 is greater. Thus, −1.2 > −1.5 because −1.2 lies to the right of −1.5. The symbol = is used when two values name the same point, such as 1/2 = 0.5. Read each comparison as a complete statement and check it against the number line before deciding which inequality symbol belongs between the numbers.
Order from Least to Greatest
To order rational numbers from least to greatest, place them on a number line and read from left to right. It can help to rewrite fractions and decimals in the same form. Consider −1.25, 1/2, −3/4, and 0. Since −3/4 equals −0.75 and 1/2 equals 0.5, the values can be compared as decimals. On the number line, −1.25 is farthest left, followed by −0.75, then 0, and then 0.5. Therefore, the order is −1.25, −3/4, 0, 1/2. Be careful with negative values: −1.25 is less than −0.75 even though 1.25 is greater than 0.75, because −1.25 lies farther left.

Apply to Real-World Situations
Positive and negative rational numbers can represent values above and below a reference point. For example, suppose the morning temperatures in three towns are −6.5°C, −2°C, and 3.5°C. On a number line, −6.5 is farthest left, −2 is next, and 3.5 is farthest right. Therefore, −6.5°C < −2°C < 3.5°C. This means the town at −6.5°C is the coldest, while the town at 3.5°C is the warmest. The comparison is about temperature, not the sizes of the digits alone. A negative temperature farther from 0 is colder. In other contexts, negative values can represent debt, a location below sea level, or a loss. Always identify what 0 and the direction of increase mean in the situation.
