
Reading Cladograms: Classifying by Common Ancestry
Students use shared derived traits to construct and interpret cladograms that classify organisms according to evidence of evolutionary relationships.
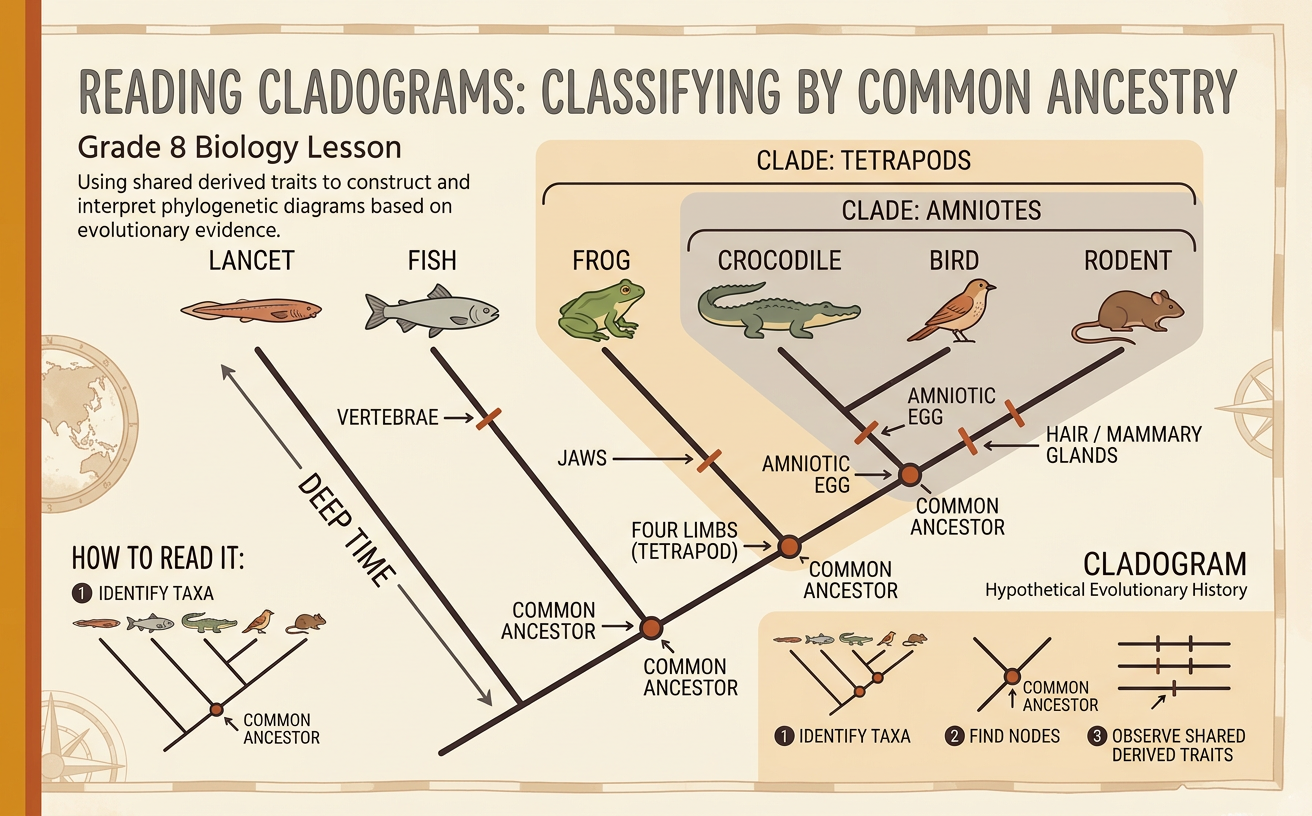
Illustrations are auto-generated and may be placeholders. They can be refreshed to match the narration.
Why Scientists Classify by Relationships
Scientists classify organisms to organize biodiversity and explain evolutionary relationships. Modern classification groups organisms by common ancestry, not simply by overall appearance or habitat. For example, dolphins and sharks both have streamlined bodies and fins because they live in water, but dolphins share more inherited anatomical traits with mammals. Dolphins breathe with lungs, nurse their young with milk, and have the same basic forelimb bone pattern as other mammals. Sharks breathe with gills and have skeletons made mostly of cartilage. Scientists compare many traits and other evidence to determine which similarities were inherited from a common ancestor. A cladogram summarizes the resulting hypothesis of relationships. It does not rank organisms as better, more advanced, or closer to a goal. Instead, it shows which groups share more recent common ancestors.
Shared and Derived Traits
A shared trait occurs in two or more organisms. A derived trait is a feature that evolved in a group’s common ancestor and differs from the ancestral condition. Scientists use shared derived traits to identify clades, which include an ancestor and all its descendants. Consider a perch, frog, lizard, and pigeon. All four have a vertebral column, but only the frog, lizard, and pigeon have four limbs. Four limbs are therefore a shared derived trait for tetrapods in this comparison. The lizard and pigeon also share the amniotic egg, which protects an embryo with specialized membranes. Feathers are derived within the pigeon’s lineage. Whether a trait is considered ancestral or derived depends on the organisms being compared. Scientists often include an outgroup, such as an earthworm, to help identify the earlier trait condition.
Anatomy of a Cladogram
A cladogram is a branching diagram that represents a hypothesis about common ancestry. The root marks the ancestral end of the diagram. Each branch point, or node, represents the most recent common ancestor of the lineages that split there. Branches lead to taxa, such as species or larger groups, at the tips. Sister taxa share an immediate node and are each other’s closest relatives on that cladogram. A derived trait may be marked on a branch, indicating that the trait likely arose in the ancestor of every lineage above that point. For example, if an amniotic egg is marked before the split between lizard and pigeon, both lineages inherited that trait from their common ancestor. Unless a scale is provided, branch length and the left-to-right order of tips do not represent time, amount of change, or importance.
Build a Cladogram from Evidence
Begin by gathering reliable evidence and placing it in a trait table. Suppose the organisms are earthworm, perch, frog, lizard, and pigeon. Use the earthworm as the outgroup because it lacks the derived vertebrate traits being compared. Mark that perch, frog, lizard, and pigeon have a vertebral column. Next, mark four limbs for frog, lizard, and pigeon; an amniotic egg for lizard and pigeon; and feathers for pigeon. Arrange organisms so groups with the most shared derived traits branch near one another. Draw the earthworm branch first, then place trait marks in order: vertebral column, four limbs, amniotic egg, and feathers. Branch each organism before the first trait it lacks. The finished cladogram should match every entry in the table. If evidence conflicts, scientists examine additional traits rather than forcing an unsupported arrangement.
Interpret Branches and Common Ancestors
To interpret a cladogram, trace two lineages backward until they meet at a node. That node represents their most recent common ancestor. On a cladogram of perch, frog, lizard, and pigeon, lizard and pigeon meet at a more recent node than either meets with frog. Therefore, lizard and pigeon are more closely related to each other than either is to frog. Frog still shares a common ancestor with both, but that ancestor is older on the diagram. Rotating branches around a node does not change these relationships. For example, switching the positions of lizard and pigeon leaves them as sister taxa. Avoid judging relatedness by which tips are physically closest across the page. Also avoid saying that one living species descended from another living species. Both lineages descended from a shared ancestral population represented by the node.
Classification Claims and Evidence
A scientific classification claim should be supported by relevant, trustworthy evidence. For example, a student might claim, “Lizards are more closely related to pigeons than to frogs.” The student can support the claim with the shared amniotic egg and other anatomical similarities inherited from a more recent common ancestor. A labeled trait table and cladogram help connect written evidence to a visual pattern. However, students should evaluate each source before using it. A museum database, peer-reviewed study, or science textbook with named experts usually has stronger authority than an unsigned website. Check when the source was produced, whether it explains how evidence was collected, and whether independent sources agree. Fossils, comparative anatomy, embryology, and DNA can provide corroborating evidence. If new reliable evidence conflicts with the cladogram, scientists may revise the classification because cladograms are testable hypotheses, not permanent facts.