Reading Climate Evidence: Carbon Dioxide, Temperature, and Future Impacts
Students interpret atmospheric carbon dioxide and temperature data, explain the physical mechanism linking them, and use climate-model projections to identify likely impacts on Earth and human systems.
Illustrations are auto-generated and may be placeholders. They can be refreshed to match the narration.
The Greenhouse Effect Mechanism
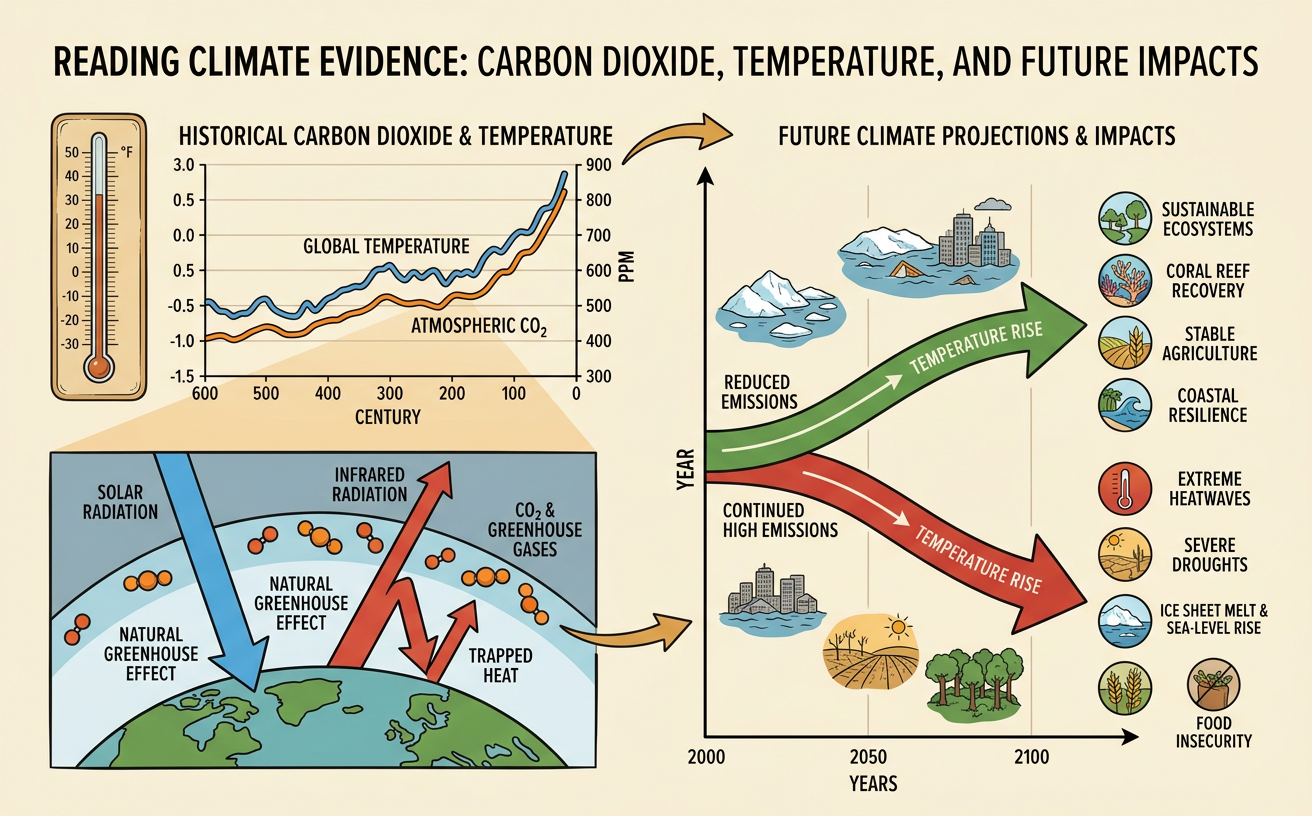
Sunlight passes through the atmosphere, and Earth’s surface absorbs much of that energy. The warmed surface releases energy as infrared radiation. Greenhouse gases, including carbon dioxide, water vapor, and methane, absorb infrared radiation at specific wavelengths and emit it in all directions. This process slows the loss of energy to space. To restore the balance between incoming and outgoing energy, the surface and lower atmosphere warm. Adding carbon dioxide strengthens this natural greenhouse effect; it does not create the effect from nothing. For example, burning coal transfers carbon that was stored underground into the atmosphere as carbon dioxide. The added gas reduces outgoing infrared energy at first, producing an energy imbalance. Earth then warms until outgoing energy again approximately balances absorbed sunlight.

Reading Carbon Dioxide and Temperature Graphs
Begin reading a climate graph by identifying the variables, units, time span, and scale. Atmospheric carbon dioxide is commonly reported in parts per million, while temperature change is often shown as an anomaly, or difference from a reference-period average. The Mauna Loa record, for example, rises from about 315 parts per million in 1958 to more than 420 parts per million in recent years. Its sawtooth pattern shows seasonal plant growth and decay, while the long-term trend rises. A temperature graph varies more from year to year, but its multi-decade trend also rises. To compare the variables, students can create a scatterplot with carbon dioxide on the horizontal axis and temperature anomaly on the vertical axis. A fitted trend line describes the direction and strength of their relationship, while points away from the line show natural variability and other influences.

Correlation, Causation, and Evidence
A correlation means that two variables change together, but correlation alone does not prove that one causes the other. The carbon dioxide-temperature relationship is supported by additional evidence. Laboratory measurements show that carbon dioxide absorbs infrared radiation. Satellites and surface instruments detect changes in radiation at carbon dioxide absorption wavelengths. Carbon accounting shows that human activities release enough carbon to explain the atmospheric increase, while carbon isotopes and declining atmospheric oxygen provide evidence that much of the added carbon comes from fossil fuels. Climate models also reproduce recent warming more accurately when human greenhouse gas emissions are included; natural factors alone do not explain the observed trend. For example, changes in solar energy cannot account for the warming pattern through the atmosphere, including warming near the surface and cooling in the stratosphere. Together, mechanism, observations, and model tests support a causal conclusion.

Interpreting Climate-Model Projections
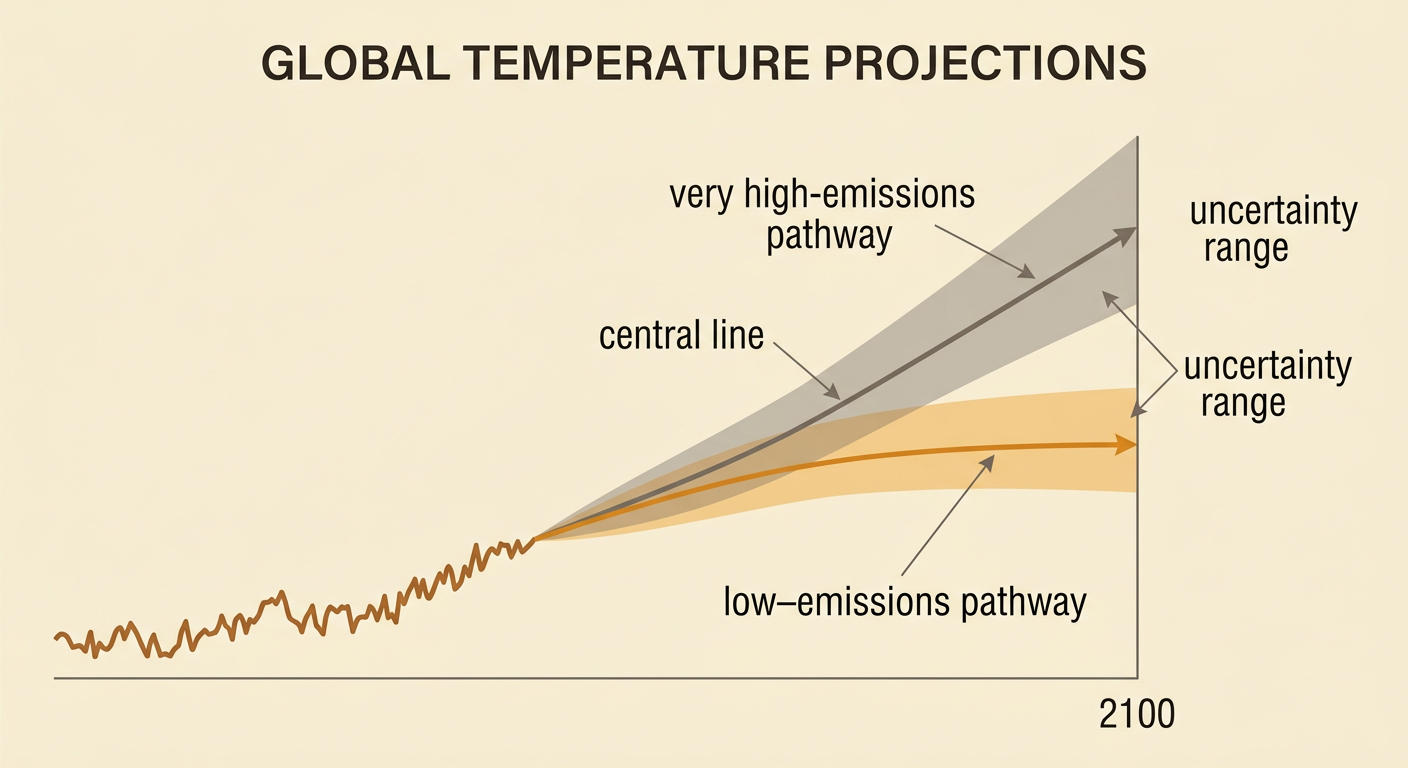
Climate models use physical laws to simulate interactions among the atmosphere, oceans, ice, land, and living systems. Model projections are conditional results based on assumptions about future greenhouse gas emissions, not exact predictions of a single future. A graph may show separate pathways for low and very high emissions. Each pathway often includes a central line and a shaded range representing differences among models and natural variability. Students should check the baseline, units, time period, scenario, and meaning of the uncertainty range before drawing conclusions. For example, two scenarios may show similar warming through the next decade because of past emissions, but they may diverge greatly by 2100. A low-emissions pathway may approach a relatively stable temperature, while a very high-emissions pathway continues rising. The widening difference shows how human decisions can influence long-term climate outcomes.
Impacts on Earth and Human Systems
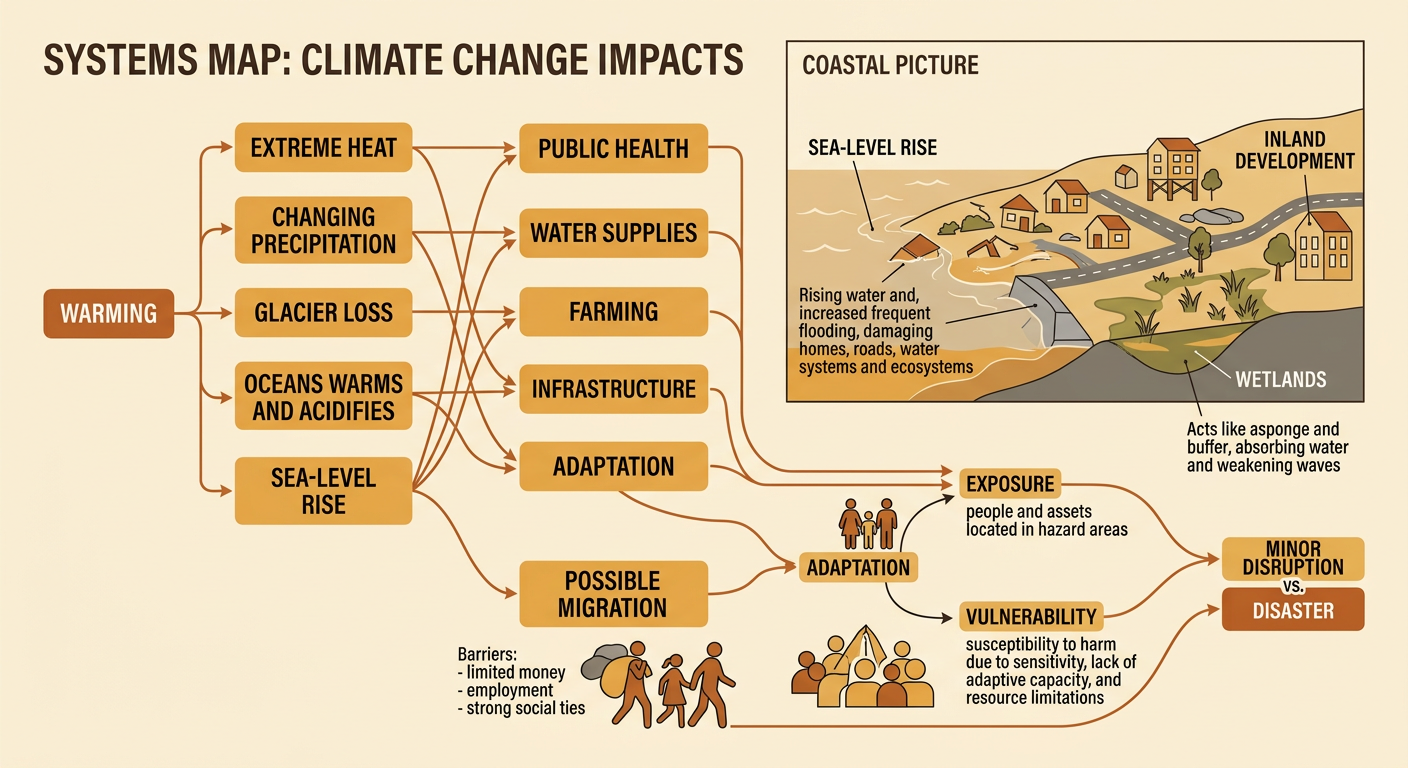
Climate change affects both Earth systems and human decisions, but impacts differ by location, exposure, and ability to adapt. Rising temperatures increase heat extremes, alter precipitation, reduce many glaciers, warm and acidify oceans, and contribute to sea-level rise. These changes can influence agriculture, water supplies, health, infrastructure, ecosystems, and energy demand. For example, a low-lying coastal community facing more frequent flooding may build protective structures, restore wetlands, elevate buildings, or move development inland. If protection is too costly, some residents may migrate, although economic resources and social ties affect who can relocate. In a drought-prone region, reduced water reliability may encourage farmers to change crops, improve irrigation, leave fields unused, or compete with growing cities for water. Forecasting impacts therefore requires combining climate projections with geographic information about population, land use, resources, and vulnerability.