Reading Motion Graphs: Position, Velocity, and Acceleration
Students interpret position-time and velocity-time graphs to describe an object's motion and calculate average velocity and acceleration.

Illustrations are auto-generated and may be placeholders. They can be refreshed to match the narration.
Describing Motion with Reference Points
Motion is a change in position compared with a reference point. A reference point is a location chosen to represent zero position. Positions on one side of zero can be positive, while positions on the other side can be negative. Before describing motion, identify the reference point and the positive direction. For example, suppose a school entrance is position 0 meters and east is positive. A student at +20 meters is 20 meters east of the entrance. If the student walks to −10 meters, the final position is 10 meters west of the entrance. The student’s displacement is −10 m − 20 m = −30 meters. The negative sign shows that the overall change was westward. Distance traveled and displacement are different: distance gives the total path length, while displacement gives the signed change from initial to final position.

Reading Position-Time Graphs
A position-time graph shows an object’s position on the vertical axis and time on the horizontal axis. The graph’s slope describes velocity. A line that rises from left to right has positive velocity, while a line that falls has negative velocity. A horizontal line means the position is not changing, so the object is at rest. A steeper line represents a greater speed because position changes more during each unit of time. For example, a cyclist’s graph rises in a straight line from 0 meters at 0 seconds to 30 meters at 5 seconds. The cyclist moves in the positive direction at a constant velocity. If the graph then stays horizontal at 30 meters from 5 to 8 seconds, the cyclist has stopped. A curved position-time graph indicates that the slope, and therefore velocity, is changing.

Calculating Average Velocity
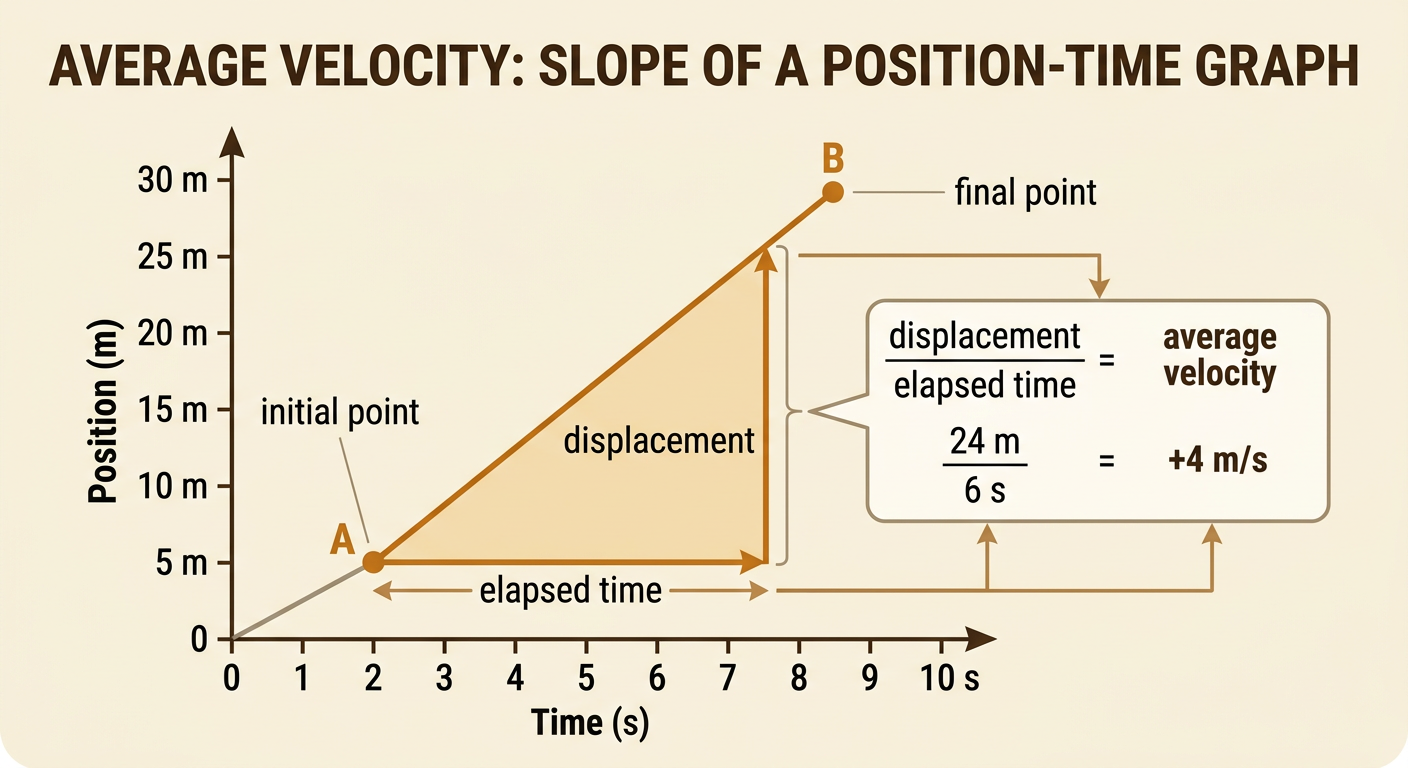
Average velocity measures displacement per unit of time. Calculate it with the equation average velocity = change in position ÷ change in time, or vavg = (xf − xi) ÷ (tf − ti). Use two points on a position-time graph and keep track of signs. For example, a robot is at 5 meters when time is 2 seconds and at 29 meters when time is 8 seconds. Its displacement is 29 m − 5 m = 24 meters, and the elapsed time is 8 s − 2 s = 6 seconds. Its average velocity is 24 m ÷ 6 s = 4 meters per second in the positive direction. On the graph, this value is the slope of the line connecting the two points. Average velocity depends on displacement, not total distance traveled, so reversing direction can reduce the result.
Reading Velocity-Time Graphs
A velocity-time graph places velocity on the vertical axis and time on the horizontal axis. A point above zero represents motion in the positive direction, while a point below zero represents motion in the negative direction. A horizontal line shows constant velocity, even when that line is below zero. A line on zero means the object is at rest. The area between the graph and the time axis represents displacement. For example, a car travels at +6 meters per second for 4 seconds. Its graph is a horizontal line at +6 m/s from 0 to 4 seconds. The rectangular area is 6 m/s × 4 s = 24 meters, so the car’s displacement is +24 meters. If velocity were −6 m/s for the same time, the displacement would be −24 meters because the graph would lie below the time axis.

Identifying Acceleration
Acceleration is the rate at which velocity changes. On a velocity-time graph, acceleration equals the slope: acceleration = change in velocity ÷ change in time. An upward slope represents positive acceleration, a downward slope represents negative acceleration, and a horizontal line represents zero acceleration. For example, a cart’s velocity increases from 2 meters per second at 1 second to 10 meters per second at 5 seconds. Its acceleration is (10 m/s − 2 m/s) ÷ (5 s − 1 s) = 2 meters per second squared. According to F = ma, an unbalanced net force causes acceleration. If the cart’s mass is 3 kilograms, the net force is 3 kg × 2 m/s² = 6 newtons in the positive direction. For the same force, a greater mass would produce a smaller acceleration.

Motion Graph Exit Check
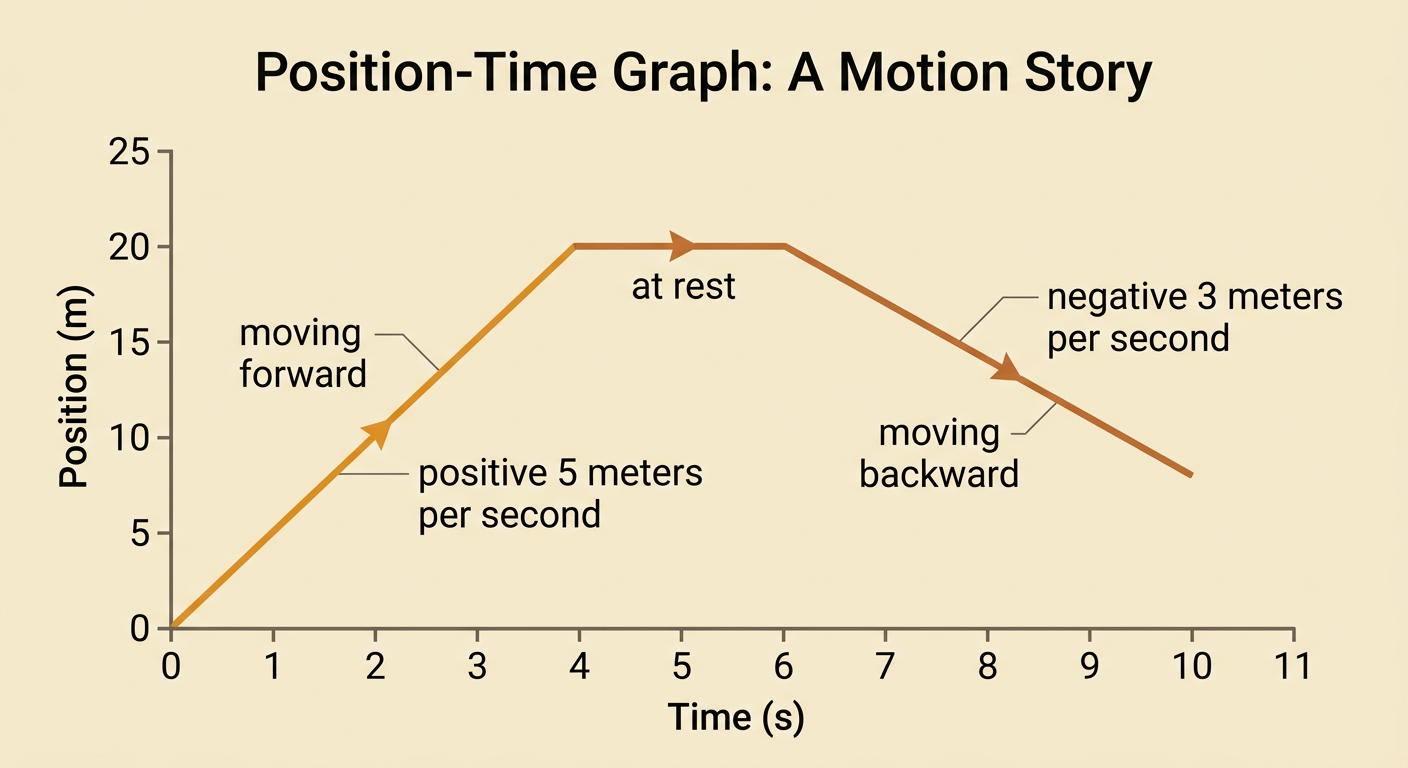
Use this example to check your understanding. A position-time graph shows a runner moving from 0 meters at 0 seconds to 20 meters at 4 seconds, remaining at 20 meters until 6 seconds, and returning to 8 meters at 10 seconds. First, describe each segment in words. Next, calculate the runner’s average velocity from 0 to 4 seconds and from 6 to 10 seconds. Finally, identify when the runner is at rest. The evidence-based answers are: the runner moves in the positive direction, stops, and then moves in the negative direction. The first average velocity is (20 − 0) ÷ (4 − 0) = +5 meters per second. The final average velocity is (8 − 20) ÷ (10 − 6) = −3 meters per second. The runner is at rest from 4 to 6 seconds because the graph is horizontal.