
Redistricting, Representation, and the Constitution
Students analyze census data, competing district maps, and constitutional principles to evaluate how redistricting choices affect political representation.

Illustrations are auto-generated and may be placeholders. They can be refreshed to match the narration.
Why Electoral Districts Change
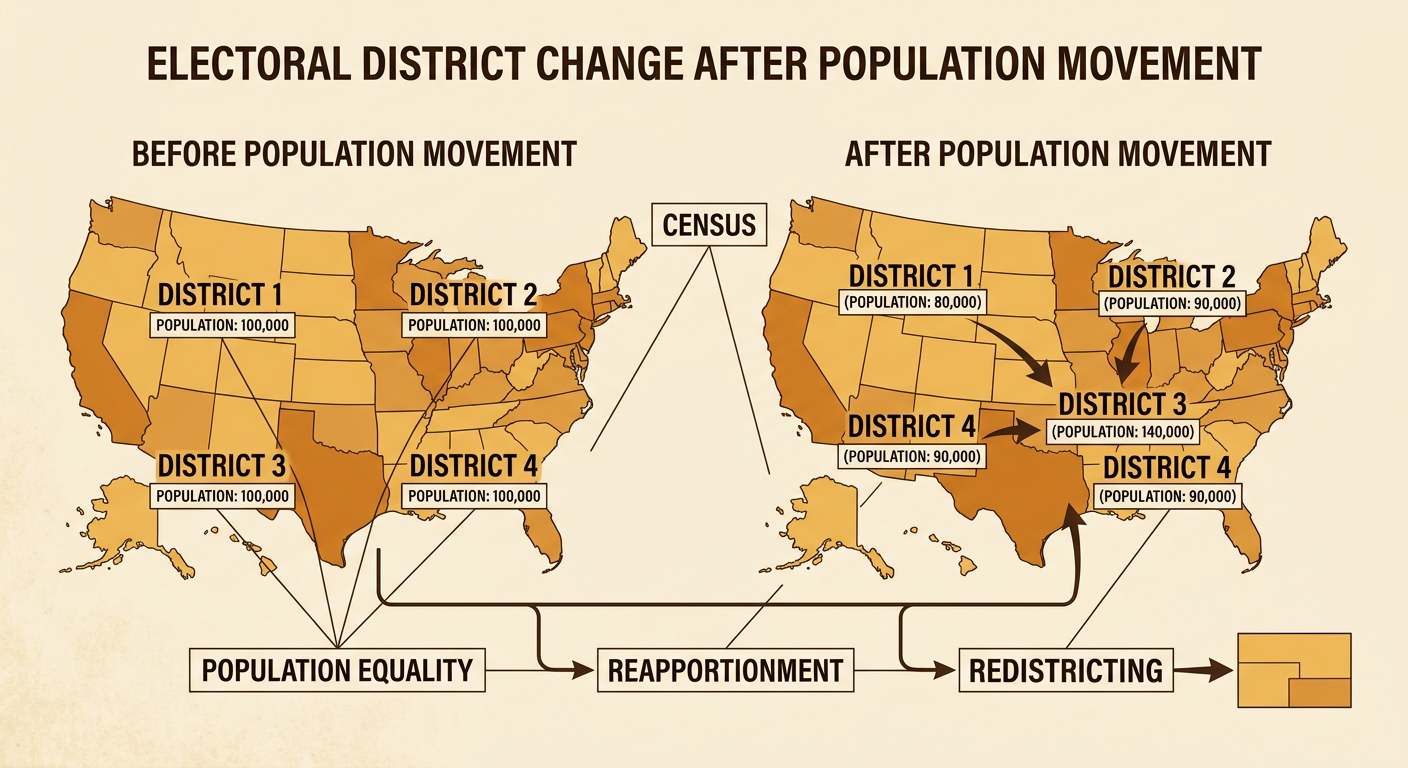
Electoral districts change because population grows, declines, and moves. The Constitution requires a national census every ten years. Census totals determine how the 435 seats in the U.S. House of Representatives are divided among the states, a process called reapportionment. States then redraw congressional and state legislative boundaries through redistricting. For example, suppose a state has four districts with 100,000 residents each. Ten years later, one district has 140,000 residents while another has only 80,000. Leaving the boundaries unchanged would give residents of the smaller district more voting power per person. Redrawing the lines can restore population equality. Depending on state law, legislators, independent commissions, or other bodies create the new maps. Their choices can affect which communities remain together and which political groups are likely to win seats.
Reading Census and Population Data
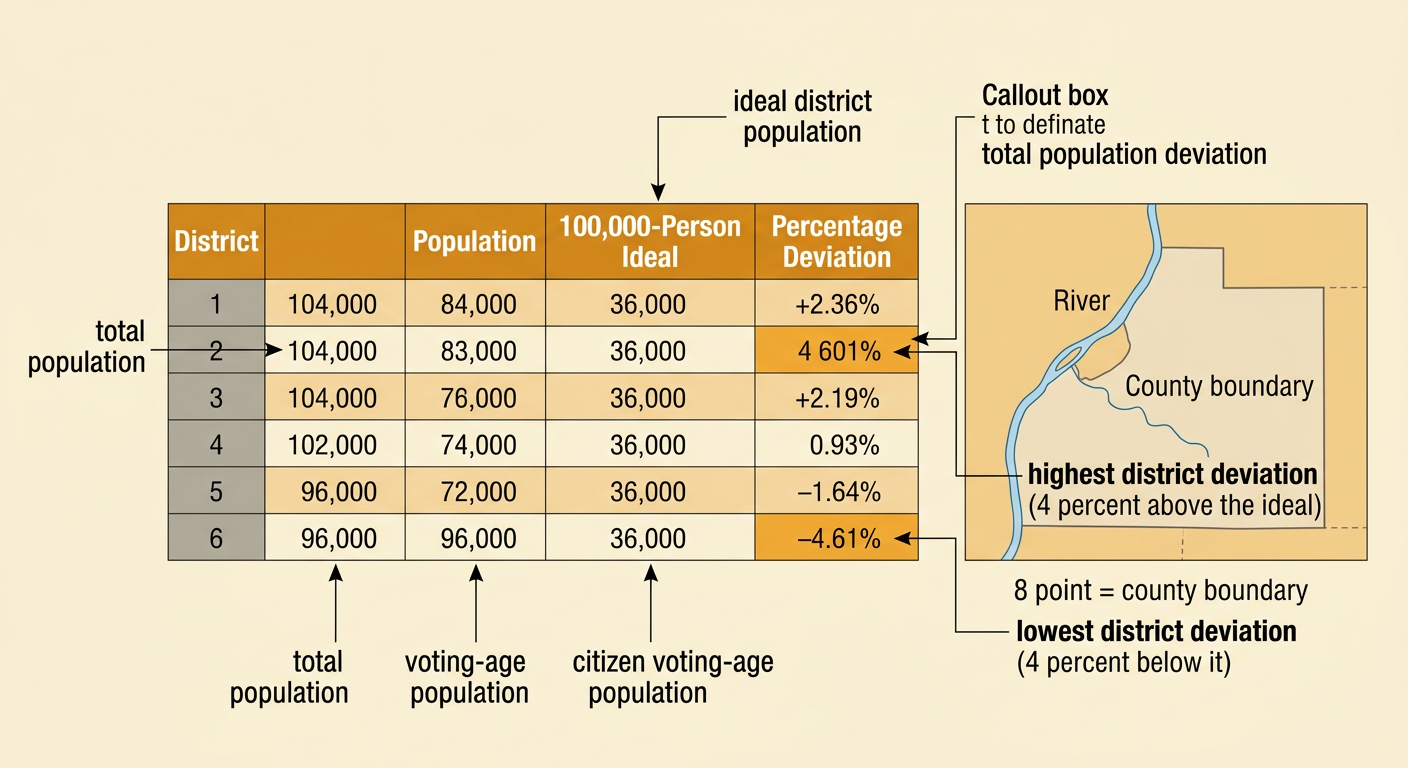
Redistricting begins with careful interpretation of census data. Mapmakers examine total population, geographic location, and demographic information for small census areas. They must distinguish total population from voting-age population and citizen voting-age population because these measures answer different questions. Suppose a fictional state has 600,000 residents and six districts. The ideal district population is 100,000, found by dividing 600,000 by six. A district with 104,000 residents is 4 percent above the ideal, while one with 96,000 is 4 percent below it. The total population deviation between them is 8 percentage points. Numbers must also be connected to geography: two areas with similar populations may be separated by a river, mountain, or county boundary. Students should verify data sources, calculate deviations consistently, and avoid assuming that population totals alone reveal political preferences or community interests.
Constitutional Rules and Voting Rights
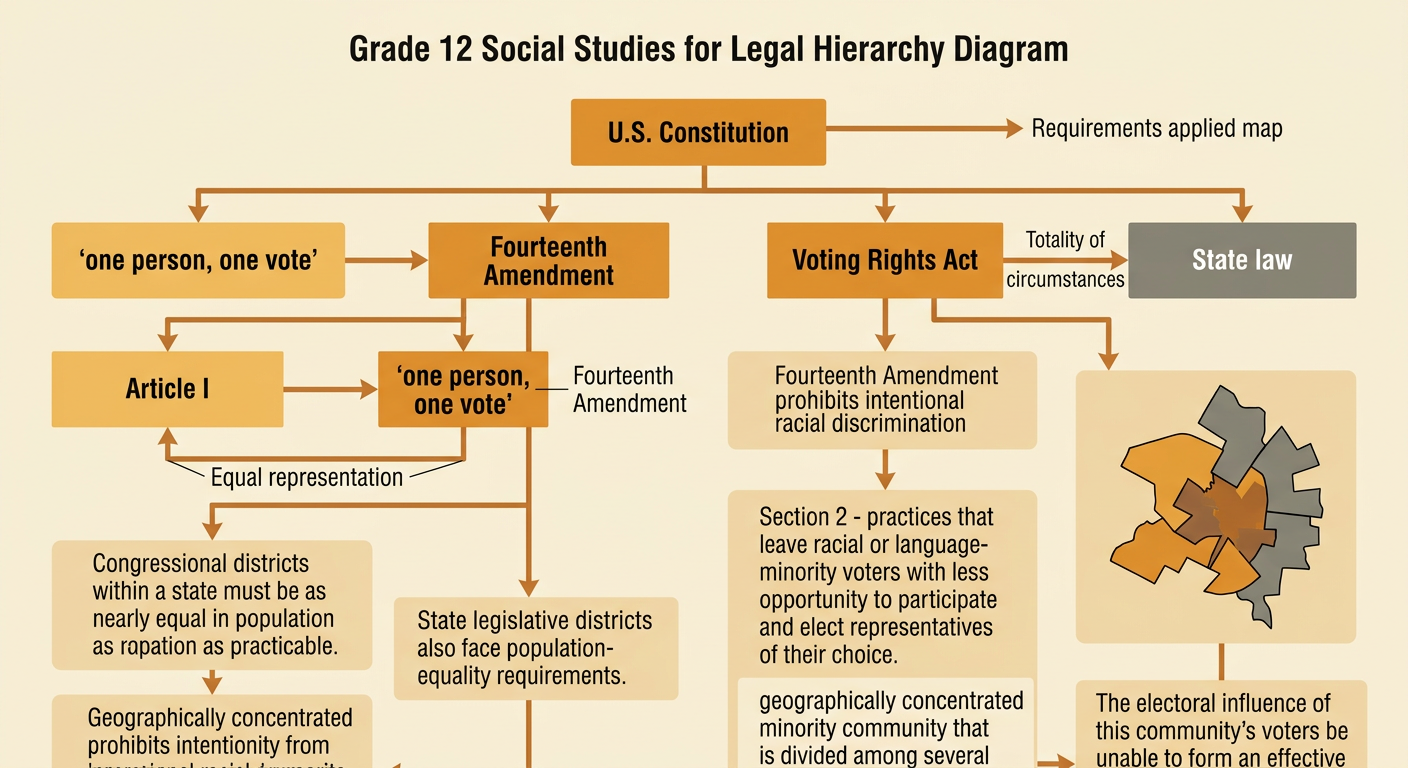
Redistricting is limited by constitutional and statutory rules. Article I and the Fourteenth Amendment support the principle of equal representation, often called one person, one vote. Congressional districts within a state must be as nearly equal in population as practicable, while state legislative districts are also subject to population equality requirements. The Fourteenth Amendment prohibits intentional racial discrimination. Section 2 of the Voting Rights Act prohibits voting practices that result in racial or language-minority voters having less opportunity to participate and elect representatives of their choice. For example, dividing a geographically concentrated minority community among several districts could weaken its electoral influence. However, race cannot be used as the predominant redistricting factor without sufficient legal justification. Courts examine evidence, context, and the totality of circumstances. People may challenge maps in federal or state court, while state constitutions and laws can impose additional standards.
Comparing Competing District Maps
No single map automatically satisfies every redistricting goal, so competing maps should be evaluated with shared criteria. Common criteria include population equality, contiguity, compactness, compliance with voting-rights law, preservation of counties or neighborhoods, and protection of communities of interest. Political outcomes can also be examined, although an unusual result alone does not prove unlawful discrimination. Imagine a state in which one party receives about 60 percent of the statewide vote across several elections. Map A gives that party four of six seats, Map B gives it two, and Map C gives it five. Students should inspect where voters live, whether districts are competitive, and whether voters were packed into a few districts or split among many. They should also test claims against numerical and geographic evidence. A strong comparison explains trade-offs: a less compact district, for instance, might preserve a connected coastal community with common economic concerns.

Evidence-Based Redistricting Recommendation
An evidence-based recommendation should prioritize legal requirements before policy preferences. First, reject maps that fail population-equality rules or violate constitutional and voting-rights protections. Next, compare remaining maps using clearly defined criteria such as contiguity, compactness, respect for political subdivisions, communities of interest, competitiveness, and public transparency. For example, students might recommend Map A because all six districts are close to the ideal population, every district is contiguous, and five counties remain whole. They should also acknowledge that Map A creates fewer competitive districts than Map B. The recommendation should cite census tables, map features, calculations, legal principles, and public testimony rather than relying on preferred election outcomes. Students can strengthen their argument by addressing a counterclaim, such as the claim that Map B better represents a regional community. Public hearings, commission review, ballot initiatives, legislation, and court challenges are ways people may support or contest redistricting rules.
