
Rivers, Floods, and the Rise of Early Civilizations
Students analyze maps, historical evidence, and flood data to explain why early civilizations developed near rivers and how communities managed environmental risks.
Illustrations are auto-generated and may be placeholders. They can be refreshed to match the narration.
River Valley Map Warm-Up
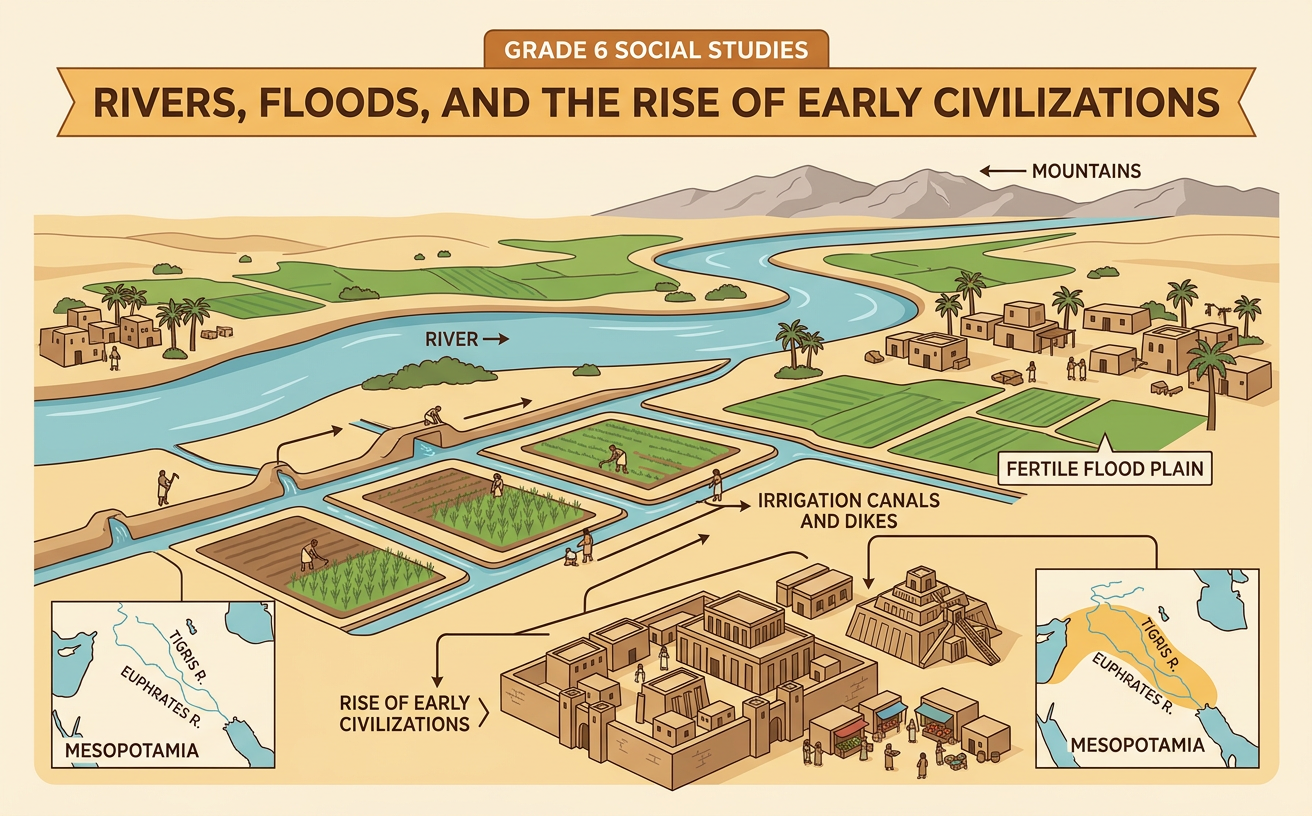
Study the locations of four early river valley civilizations: Egypt along the Nile River, Mesopotamia between the Tigris and Euphrates Rivers, the Indus Valley civilization near the Indus River, and early Chinese states near the Huang He. Look for patterns in where settlements formed. Each region had communities beside rivers even though deserts, mountains, or seas separated the regions. Rivers supplied water and fertile land, but they could also flood. For example, many Egyptian settlements stood near the Nile because most surrounding land was dry desert. Use map evidence when describing the pattern. A strong observation might state, “Major settlements appear close to rivers and on nearby plains.” Then ask a geographic question: How did access to river water influence where people lived, farmed, and traveled?

Benefits of Settling Near Rivers
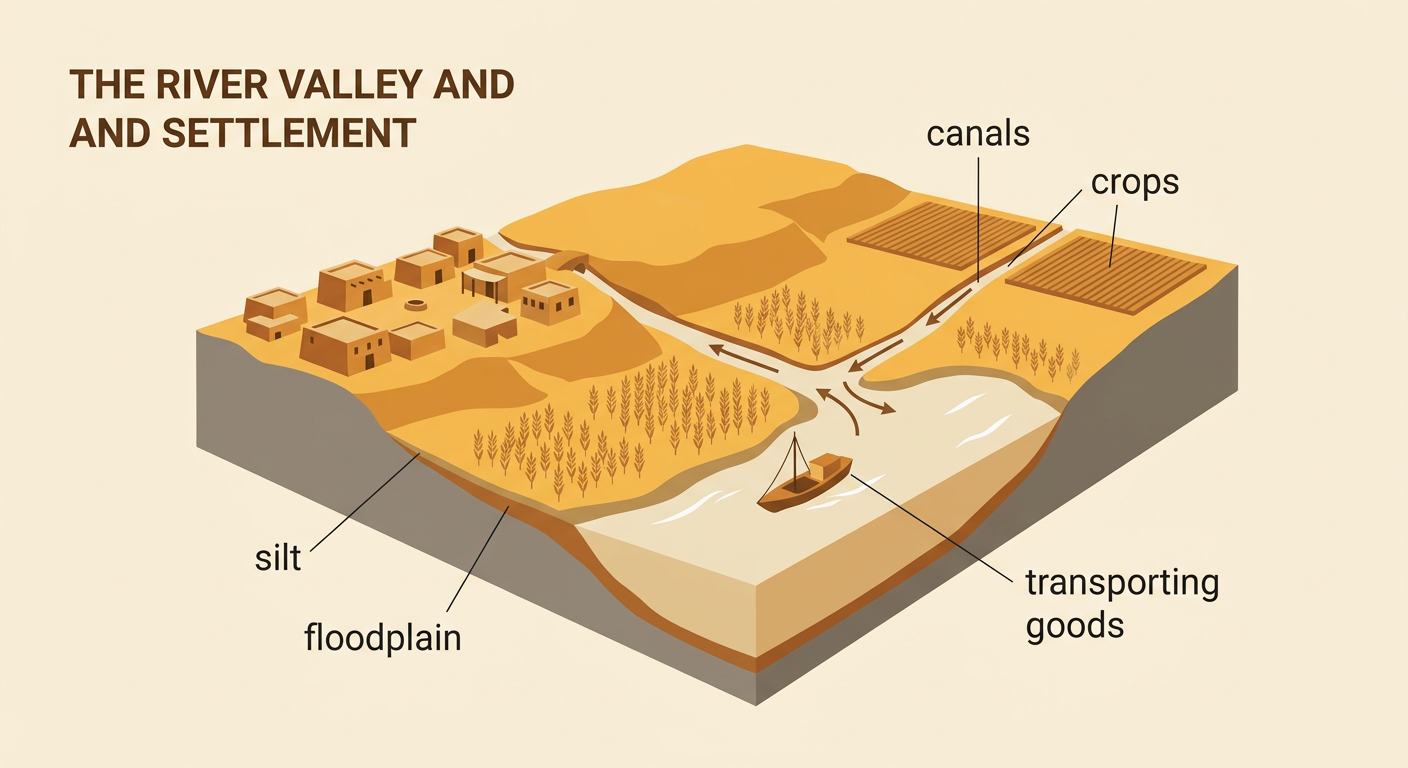
Rivers offered several advantages to early communities. People could drink river water, water crops, catch fish, transport goods, and make mud bricks from riverbank soil. Floodwater often left behind sediment, called silt, that added nutrients to farmland. Farmers could dig canals to move water to fields farther from the river. Reliable food supplies supported population growth and allowed some people to become builders, traders, craftspeople, soldiers, or government officials. For example, the Nile usually rose during a regular season, covering parts of its floodplain with water and silt. Egyptian farmers planted crops as the water withdrew. However, river settlement involved risk. A flood that rose too high could destroy homes and crops, while a low flood could leave too little water for farming. Rivers created both opportunities and hazards.
Reading Historical Evidence
Historians use primary and secondary sources to investigate life near rivers. A primary source was created during the time being studied, such as a law, tool, inscription, or tomb painting. A secondary source is a later explanation based on evidence, such as a history book. An ancient Egyptian tomb painting showing workers using irrigation equipment is primary visual evidence that people moved water to support farming. A modern historian might use that image, tools, and environmental studies to explain Egyptian agriculture. When making an inference, cite a specific detail instead of giving only an opinion. For example: “The painting shows workers lifting water beside cultivated fields, which suggests that farmers managed river water.” Also consider a source’s creator, purpose, and limits. One painting can show an activity, but it cannot prove that every farmer used the same method.

Analyzing Flood Data
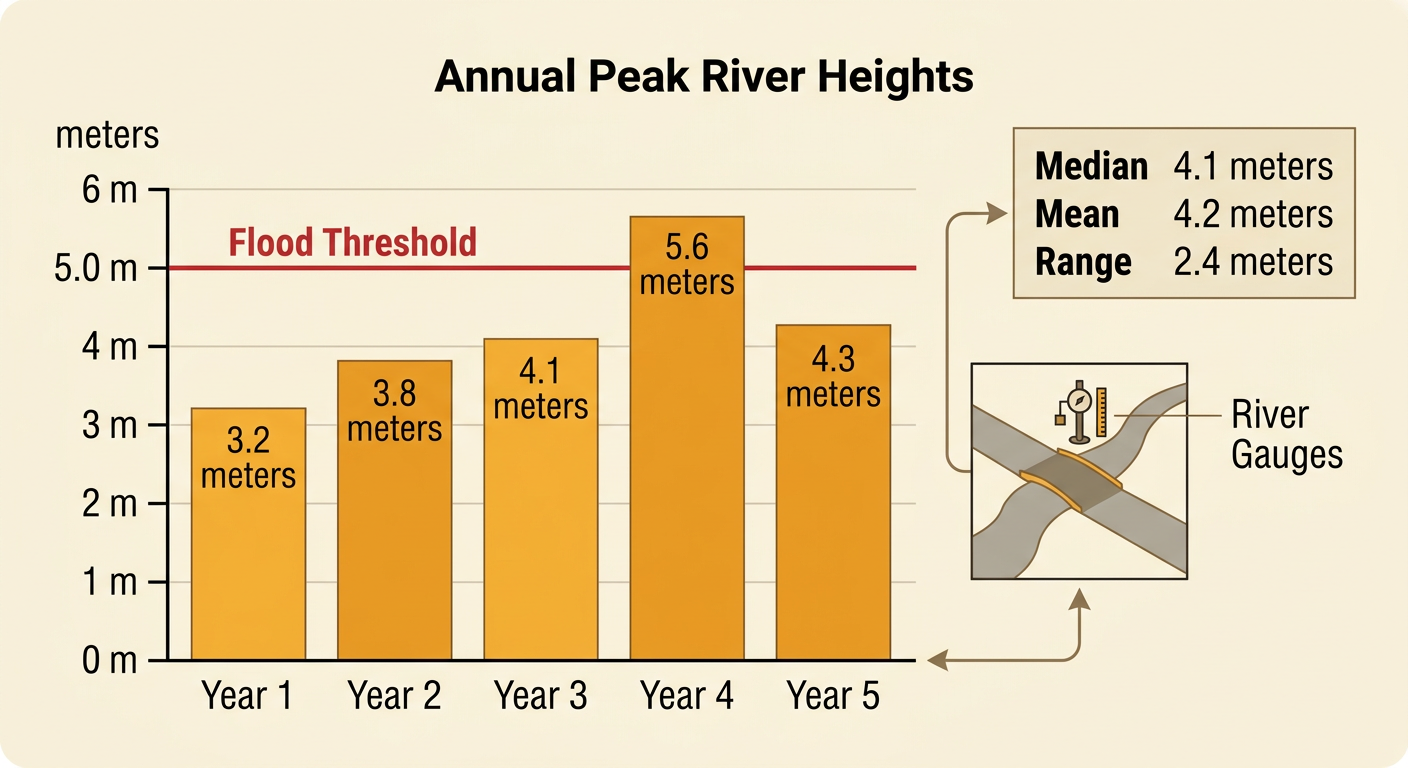
Flood data help communities recognize patterns and estimate risk. Consider this five-year set of annual peak river heights: 3.2, 3.8, 4.1, 5.6, and 4.3 meters. There are five observations. In order, the middle value, or median, is 4.1 meters. The mean is 4.2 meters, and the range is 2.4 meters because 5.6 minus 3.2 equals 2.4. Suppose flooding begins at 5.0 meters. One of the five recorded years crossed that threshold, so the data show that a damaging flood was possible but not yearly. A community might strengthen barriers or avoid building in the lowest areas. However, five years are not enough to predict exactly when the next flood will happen. Scientists use longer records, rainfall measurements, snowmelt information, and river gauges to make better forecasts.
Human Responses to Flooding
River communities changed their environments to gain benefits while reducing flood damage. They built levees or embankments to hold back some water, dug canals and drainage channels, stored grain, and placed important buildings on higher ground. They could also watch seasonal river changes and move people or animals before rising water arrived. In Mesopotamia, communities constructed irrigation and flood-control systems along the Tigris and Euphrates Rivers. These projects required workers, planning, rules, and maintenance, which encouraged organized government. Human responses sometimes created new problems. A failed levee could release water suddenly, and poorly drained irrigation could leave salts in the soil. Modern communities use river gauges, warning systems, flood maps, evacuation routes, wetlands, and building limits on floodplains. No response removes all risk, so communities compare costs, benefits, and possible unintended effects.

Claim-Evidence-Reasoning Exit Ticket
Write a claim answering this question: Why did early civilizations develop near rivers despite flood risks? Support the claim with at least two specific pieces of evidence from the lesson, including one map or historical-source detail and one numerical fact. Then explain how each piece of evidence supports the claim. For example, a claim could state that river valleys attracted settlements because they supported farming and transportation, while organized communities found ways to manage floods. Evidence might include the map pattern showing settlements near major rivers and the data set in which only one of five peak heights exceeded 5.0 meters. The reasoning should connect these facts to the claim: regular access to water and fertile floodplains offered continuing benefits, while occasional dangerous floods encouraged levees, canals, warnings, and coordinated labor. End by acknowledging that flood risk could be reduced but not eliminated.
