
Scientific Inquiry: Designing and Evaluating a Controlled Investigation
Students use an iterative scientific inquiry process to develop a testable hypothesis, identify variables and controls, analyze evidence, and revise explanations based on the reliability and limitations of an investigation.
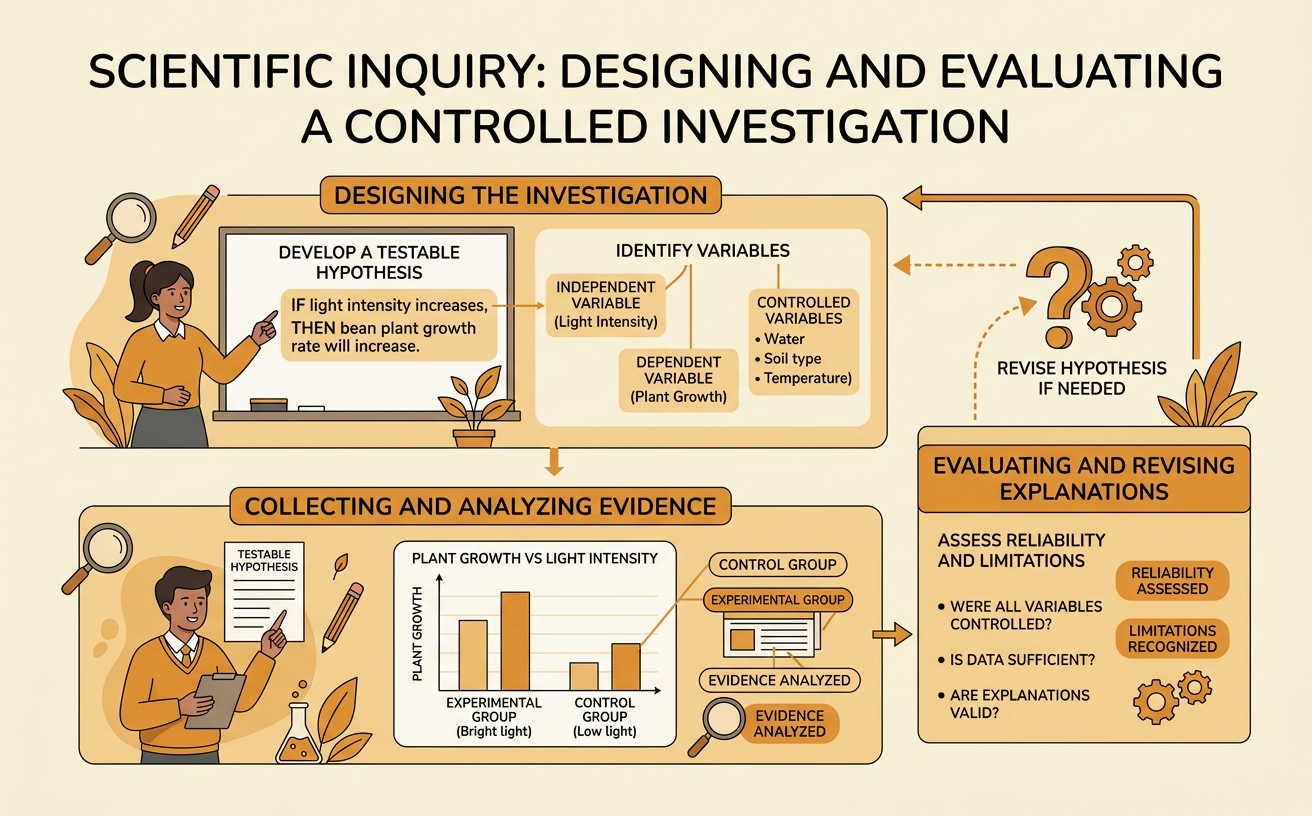
Illustrations are auto-generated and may be placeholders. They can be refreshed to match the narration.
Scientific Inquiry as an Iterative Process
Scientific inquiry is an organized but iterative process for answering questions with evidence. Scientists observe a phenomenon, ask a focused question, develop a hypothesis, design and conduct a test, analyze data, and draw a conclusion. The process is not a one-way checklist. Unexpected results or weaknesses in a procedure may lead to a revised question, improved method, or new test. For example, students might test whether fertilizer concentration affects bean plant growth. If several plants die at the highest concentration, students should not simply discard those results. They might investigate whether the concentration was harmful, check whether watering was consistent, and repeat the investigation with smaller concentration intervals. Careful records allow another group to follow the same multistep procedure and evaluate whether the findings are reliable.
Questions, Models, and Testable Hypotheses
A useful scientific question identifies a measurable relationship, such as, “How does ramp angle affect the distance a toy car travels after leaving the ramp?” A model represents the important parts of a system and helps predict what may happen. A testable hypothesis states an expected relationship and can be supported or challenged with data. One hypothesis is, “If ramp angle increases, then travel distance will increase because the car will gain more speed while descending.” Before testing, students should gather relevant background information from textbooks, scientific organizations, and other sources. They should consider each source’s origin, author expertise, structure, purpose, date, and context. A hypothesis must not be a guess that cannot be measured. It should connect the proposed cause, expected effect, and scientific reasoning.
Independent, Dependent, and Controlled Variables
Variables are factors that can change during an investigation. The independent variable is the factor deliberately changed by the investigator. The dependent variable is the measured response. Controlled variables are factors kept the same so they do not provide competing explanations for the results. Suppose students test how light intensity affects the photosynthesis rate of an aquatic plant. They change the lamp’s distance from the plant, which changes light intensity, and count oxygen bubbles produced per minute as the dependent variable. The plant species, water volume, water temperature, observation time, and carbon dioxide availability should remain constant. Only one main independent variable should be changed at a time. If water temperature also rises near the lamp, students cannot confidently determine whether light intensity or temperature caused the change in oxygen production.
Controls, Repeated Trials, and Measurement
A control provides a comparison for judging the effect of the independent variable. In an investigation of whether a disinfectant reduces bacterial growth, a treated plate can be compared with a control plate that receives no disinfectant. Both plates must otherwise be prepared and incubated in the same way. Repeated trials increase reliability because one unusual result has less influence on the overall pattern. Students can calculate the mean of several measurements and report the range to show variation. Measurement tools should match the needed precision, and procedures should state units, timing, quantities, and instrument use clearly. For example, measuring each bacterial inhibition zone in millimeters with the same ruler is more reproducible than describing zones as “large” or “small.” Safety procedures and sterile technique must also be followed consistently.
Analyzing Data and Evaluating Error
Data analysis begins by organizing observations in tables and graphs, calculating useful summaries, and looking for patterns. The independent variable belongs on the x-axis, and the dependent variable belongs on the y-axis. Suppose students measure reaction time at several water temperatures. A graph may show that reaction time decreases as temperature rises, but one point may fall far from the overall trend. Students should check records and procedures before deciding whether that point reflects natural variation or an error. Random error causes measurements to vary unpredictably and can be reduced through repeated trials. Systematic error shifts measurements in a consistent direction, such as a thermometer that always reads two degrees too high. Investigators should also evaluate sample size, instrument precision, uncontrolled variables, missing data, and whether evidence from outside sources is relevant and authoritative.
Drawing Conclusions and Revising Explanations
A conclusion answers the original question by using specific evidence and explaining whether the data support the hypothesis. Support does not mean that a hypothesis has been permanently proven. Students must also identify weaknesses, alternative explanations, and limits on how widely the findings can be applied. Imagine that seeds exposed to eight hours of light germinated at a higher percentage than seeds exposed to two hours. The conclusion should cite the group means and variation, not merely say that more light was “better.” If the eight-hour group was also warmer, temperature is a confounding variable and weakens the claim about light. Students could revise the explanation, control temperature in a new investigation, increase the sample size, and repeat the trials. Strong scientific explanations change when reliable new evidence reveals a better account of the phenomenon.