
Scientific Inquiry: Designing and Evaluating Investigations
Students develop a testable hypothesis, design a controlled investigation, analyze data for patterns and uncertainty, and explain how evidence may support, challenge, or refine a scientific claim.
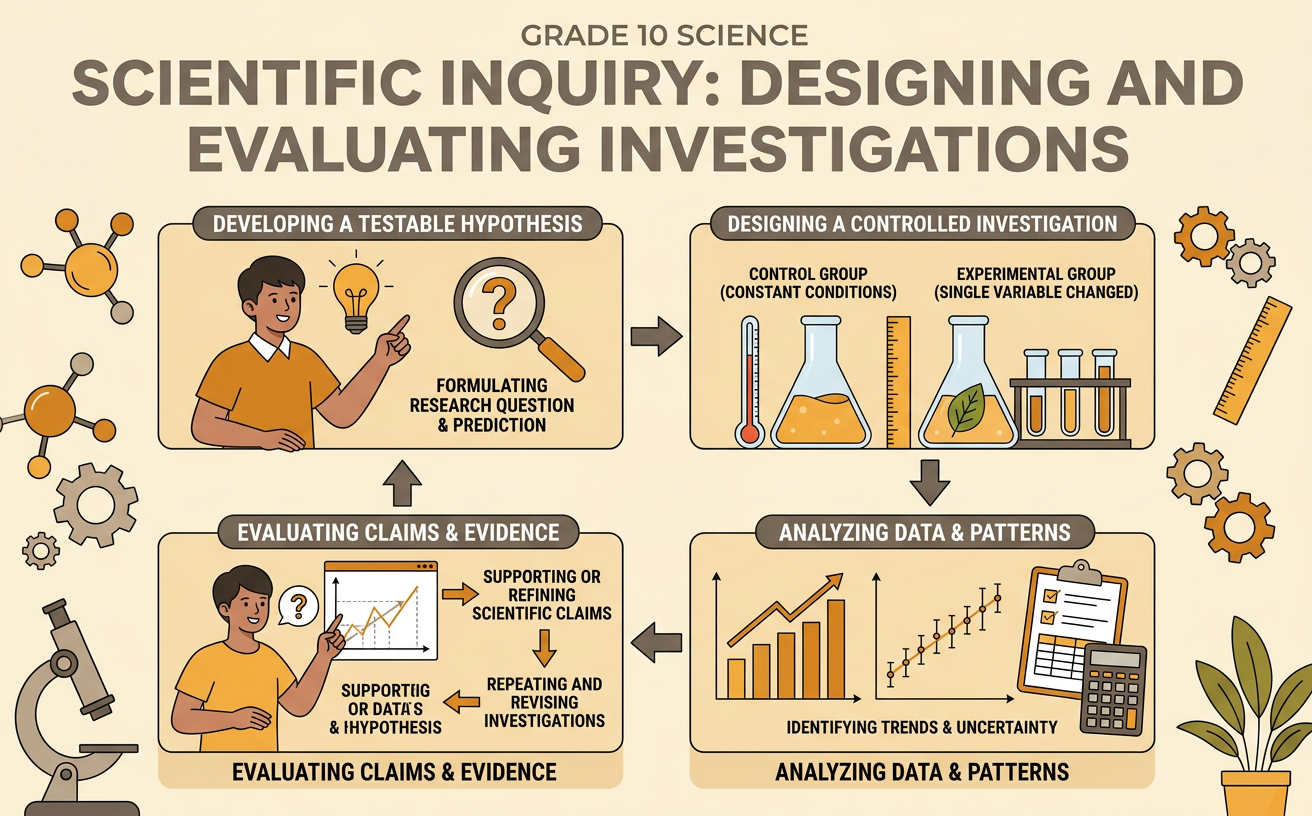
Illustrations are auto-generated and may be placeholders. They can be refreshed to match the narration.
Scientific Inquiry as an Iterative Process
Scientific inquiry is a repeating process for answering questions with evidence. Scientists observe a phenomenon, ask a focused question, review reliable background sources, form a hypothesis, plan and conduct an investigation, analyze data, and communicate a conclusion. Results often lead to revised questions or improved methods rather than a final answer. For example, a student may notice that bean plants near a window grow at different rates. After consulting plant biology references, the student investigates whether daily light duration affects growth. If the measurements vary widely, the student might repeat the investigation with more plants or better control of temperature. Good inquiry also requires deciding what evidence is needed, where it can be obtained, and whether each source or measurement is trustworthy. This iterative approach helps scientific explanations become more precise and reliable over time.
Questions, Hypotheses, and Predictions
A testable question names a factor that can be changed and an outcome that can be measured. “How does daily light duration affect the weekly height increase of bean plants?” is testable because light duration can be varied and height can be measured. A hypothesis is a tentative, evidence-based explanation, not a guess or a question. One hypothesis is: Increasing daily light duration will increase bean plant growth because additional light can support more photosynthesis, up to the plant’s biological limit. A prediction states the expected result under specific conditions: If identical bean plants receive 4, 8, or 12 hours of light each day, then plants receiving 12 hours will have the greatest mean weekly height increase. Results can fail to match the prediction without making the investigation useless; unexpected evidence may reveal a flawed explanation, an uncontrolled variable, or a new question.
Variables, Controls, and Experimental Design
A controlled investigation changes one independent variable and measures its effect on a dependent variable while holding other relevant conditions constant. In the bean plant study, daily light duration is the independent variable, and weekly height increase in centimeters is the dependent variable. Plant species, starting size, soil type, pot size, water volume, temperature, light intensity, and measurement schedule should remain constant. A control group receiving a standard 8-hour light period provides a comparison. Randomly assigning similar plants to the 4-, 8-, and 12-hour groups reduces selection bias. Using at least ten plants per group provides replication and makes one unusual plant less influential. Students should follow the same written procedure for every group, calibrate measuring tools, record units, and address safety concerns. Repeated trials and sufficient data make it easier to distinguish a consistent effect from ordinary biological variation.
Data Patterns, Error, and Reliability
After collecting data, investigators organize measurements in tables and graphs to identify patterns. For the plant study, a scatter plot can show light duration on the horizontal axis and weekly height increase on the vertical axis. A line of best fit may reveal a positive association, but it does not prove that every plant follows the pattern. The mean summarizes each group, while the range, interquartile range, or standard deviation describes variability. Error bars can display uncertainty or variation around a mean. Random error, such as slightly different ruler placement, increases scatter. Systematic error, such as a ruler with an incorrect zero point, shifts measurements in a consistent direction. Reliability improves when procedures are repeated, sample sizes are sufficient, instruments are calibrated, and results are similar across trials. Outliers should be investigated and reported rather than removed simply because they do not fit the expected pattern.
Evidence-Based Conclusions and Revision
A scientific conclusion answers the inquiry question by connecting the claim to relevant evidence and reasoning. Suppose the bean plants receiving 4, 8, and 12 hours of light grew an average of 2.1, 4.0, and 4.3 centimeters per week. The evidence supports the claim that growth increased from 4 to 8 hours, but the small difference between 8 and 12 hours may not be meaningful if the groups have wide, overlapping error bars. The original hypothesis should therefore be refined: Additional light may increase growth only until another factor becomes limiting. A strong conclusion also identifies limitations, such as a short investigation, small samples, or uncontrolled temperature differences. It does not claim that the hypothesis was permanently proven. Students can improve the next investigation by collecting data for more weeks, increasing replication, measuring temperature, or testing additional light durations between 8 and 12 hours.