
Scientific Investigations: From Questions to Evidence
Students examine the scientific method as an iterative process by developing a testable question, identifying variables and controls, planning reliable measurements, analyzing data, and revising a claim based on evidence and uncertainty.
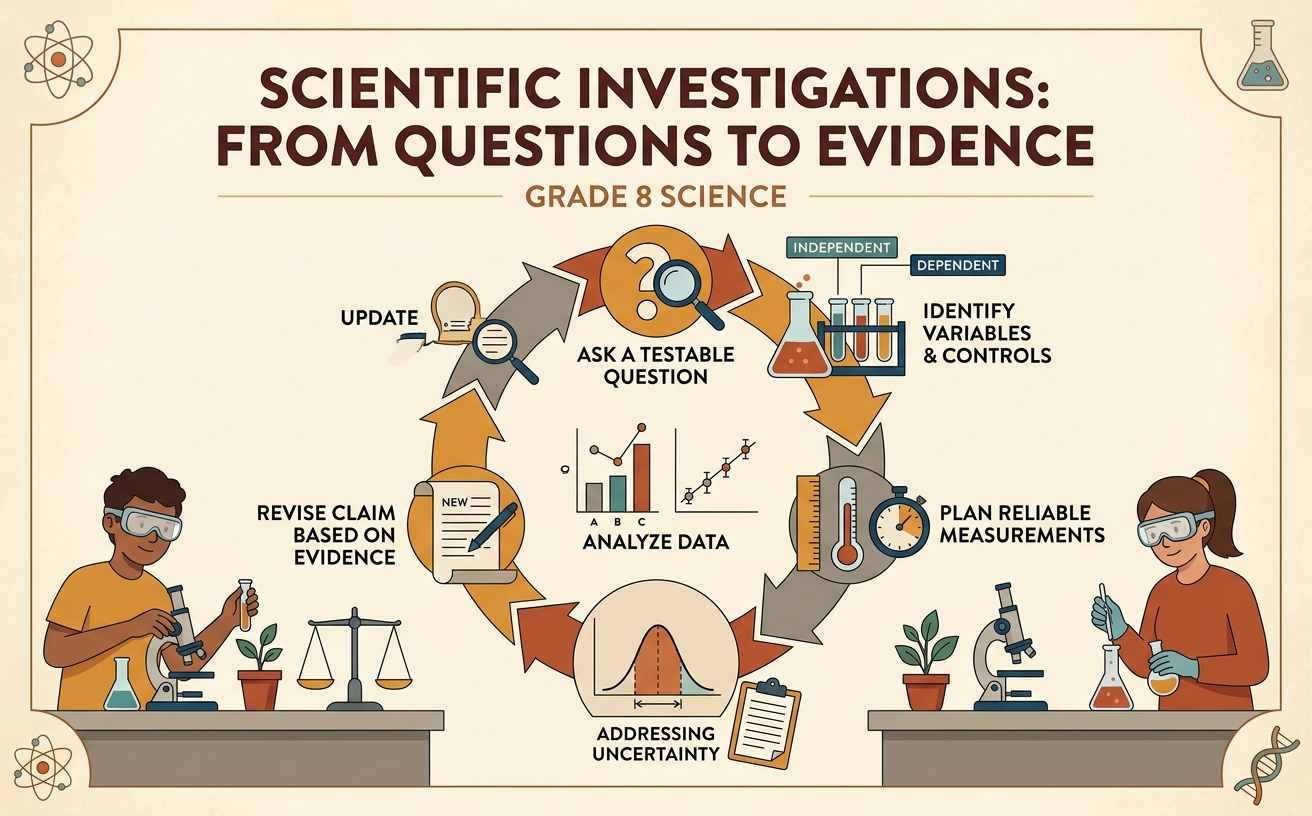
Illustrations are auto-generated and may be placeholders. They can be refreshed to match the narration.
The Scientific Method as an Iterative Process
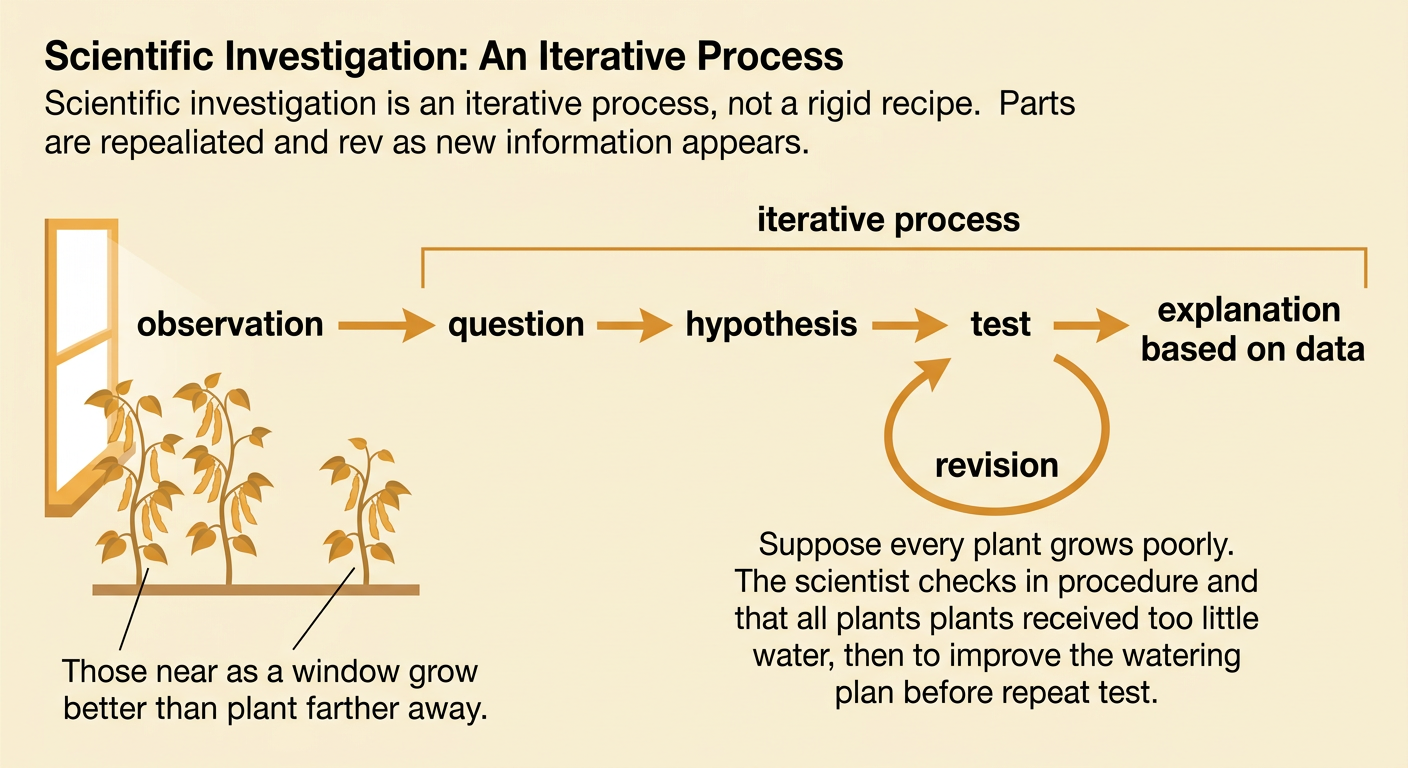
Scientific investigation is not a rigid list of steps that always ends with a final answer. It is an iterative process, meaning scientists repeat and revise parts of an investigation as they learn. They may begin by observing that bean plants near a window grow differently from plants farther away. They ask a question, form a hypothesis, plan and conduct a test, analyze data, and develop an explanation. Unexpected results may lead them to check measurements, change the procedure, or ask a new question. For example, if all tested plants grow poorly, the scientists might discover that the plants received too little water. They can improve the watering plan and repeat the investigation. Careful revision is not failure; it is how scientific explanations become more reliable and better supported by evidence.
Testable Questions and Hypotheses
A testable question can be answered by collecting measurable evidence under defined conditions. Strong questions identify what will be changed and what will be measured. Instead of asking, “Do plants like fertilizer?” a student could ask, “How does the amount of fertilizer affect the height of bean plants after 21 days?” This question can be tested by using several fertilizer amounts and measuring plant height in centimeters. A hypothesis is a proposed explanation that leads to a prediction. A student might state, “If bean plants receive a moderate amount of fertilizer, then they will grow taller because fertilizer supplies nutrients needed for growth.” The hypothesis must be open to being supported or not supported by evidence. Questions based only on opinions, such as which plant looks nicest, are not scientifically testable unless subjective terms are replaced with measurable criteria.

Independent Variables, Dependent Variables, and Controls
The independent variable is the factor deliberately changed by the investigator. The dependent variable is the outcome measured in response. In a bean plant investigation, fertilizer amount could be the independent variable, and plant height after 21 days could be the dependent variable. A control group receives no fertilizer, providing a baseline for comparison. Controlled variables are conditions kept the same, such as plant species, soil type, pot size, water amount, light exposure, and growing time. If one group receives more fertilizer and more sunlight, the investigator cannot determine which factor affected growth. A fair test changes only the independent variable while holding other relevant conditions constant. Several fertilizer levels, including zero, can reveal whether the response changes across a range rather than only showing a difference between two groups.

Reliable Measurements and Repeated Trials
Reliable measurements are collected consistently with appropriate tools and units. Before beginning, investigators should write a precise, multistep procedure that another person could follow. For the bean plants, students might measure from the soil surface to the highest point of each stem using the same centimeter ruler every three days at the same time. The ruler should begin at zero and be viewed at eye level to reduce reading error. Repeated trials improve reliability because a single plant may grow unusually fast or slowly. Testing five plants at each fertilizer level provides more useful evidence than testing one plant per level. Students should record every result, not remove values simply because they are unexpected. If a tool fails or a procedure changes, they should note it. Consistent methods and sufficient trials make patterns easier to distinguish from random variation.
Analyzing Data and Recognizing Uncertainty
Data analysis helps investigators identify patterns and judge how strongly evidence supports a hypothesis. Students can organize plant heights in a table, calculate the mean height for each fertilizer level, and graph the results. On the graph, fertilizer amount belongs on the horizontal x-axis because it is the independent variable. Mean plant height belongs on the vertical y-axis because it is the dependent variable. Imagine that plants receiving 10 milliliters of fertilizer have the greatest mean height, while the 15-milliliter group grows less. This pattern suggests that more fertilizer is not always better. However, measurements contain uncertainty from ruler precision, natural differences among plants, and uncontrolled changes in temperature or light. Averages, ranges, individual data points, and error bars can reveal variation. An unusual result should be examined and reported rather than automatically discarded.

Claims, Evidence, Reasoning, and Revision
A scientific argument connects a claim to evidence through reasoning. A claim answers the investigation question. Evidence includes relevant measurements, calculated results, and information from credible sources. Reasoning explains why the evidence supports the claim using scientific ideas. For example, a student might claim that 10 milliliters of fertilizer produced the greatest bean plant growth under the tested conditions. The student would cite mean heights from all groups and explain that plants need nutrients, while excessive fertilizer can interfere with water uptake. The argument should also acknowledge limitations, such as a small sample, a short growing period, or variation in light. Students can compare their results with classmates’ data and reliable reference sources, then critique whether alternative explanations fit the evidence. If new evidence conflicts with the original claim, the claim should be narrowed, revised, or rejected rather than defended without support.