
Solubility and Solution Formation
Students use particle-level models and solubility curves to explain how molecular attractions, temperature, and pressure affect the formation and concentration of solutions.
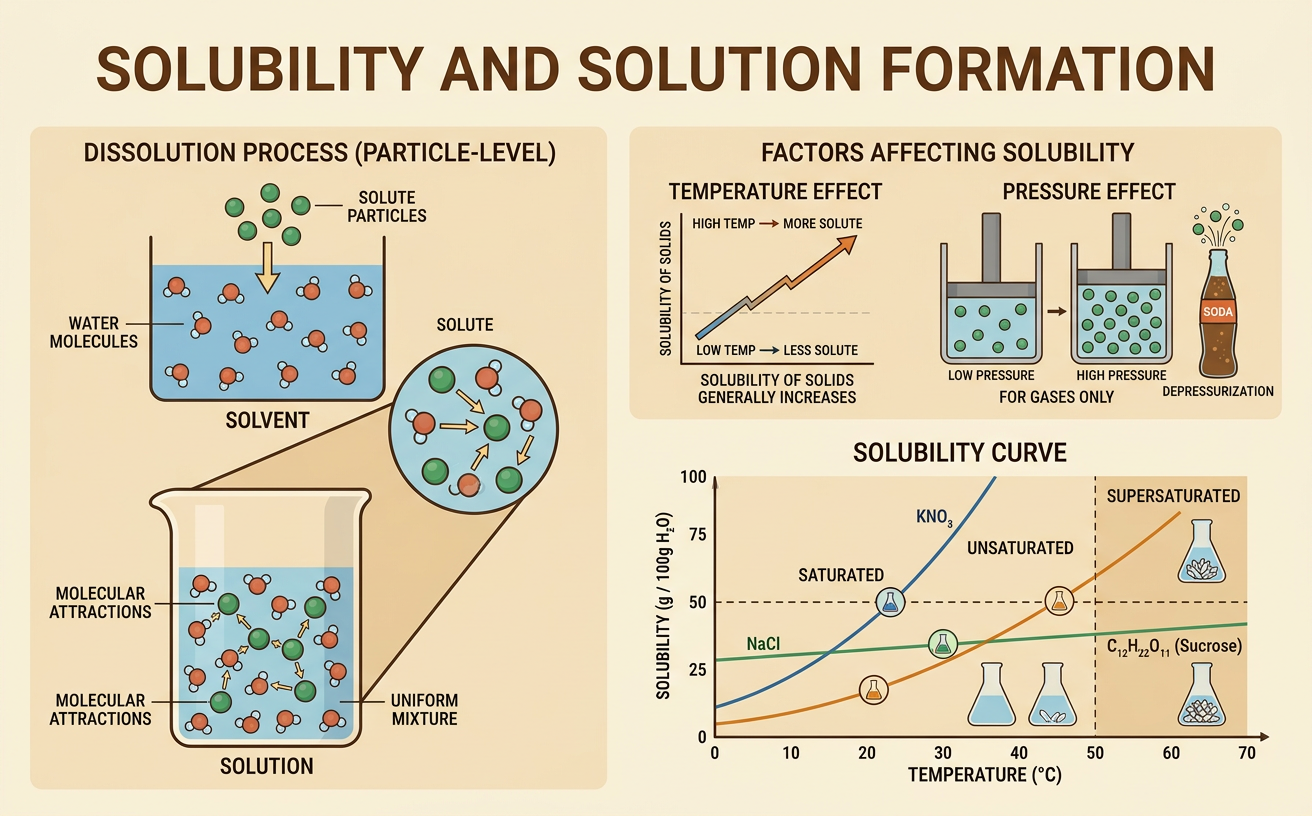
Illustrations are auto-generated and may be placeholders. They can be refreshed to match the narration.
Solutes, Solvents, and Solutions
A solution is a homogeneous mixture in which particles are evenly distributed at the molecular or ionic level. The substance present in the larger amount is usually the solvent, and each substance dissolved in it is a solute. During dissolving, solute particles separate and spread among solvent particles; they do not disappear or change into energy. For example, when table salt dissolves in water, the salt crystal separates into sodium ions and chloride ions. Water is the solvent, and salt is the solute. Saltwater looks uniform because the ions are too small to see and are distributed throughout the liquid. Solutions can also be gases or solids. Air is a solution of gases, while brass is a solid solution mainly containing copper and zinc. The physical state of a solution usually matches the physical state of its solvent.

How Particle Attractions Drive Dissolving
Dissolving depends on attractions among solute particles, among solvent particles, and between solute and solvent particles. A solute tends to dissolve when new solute-solvent attractions can replace the attractions that must be broken. Water molecules are polar: their oxygen side is partially negative, and their hydrogen sides are partially positive. When sodium chloride dissolves, the oxygen sides of water molecules attract positive sodium ions, while the hydrogen sides attract negative chloride ions. These ion-dipole attractions pull ions from the crystal and keep them separated in the solution. In contrast, nonpolar oil does not mix well with polar water because oil-water attractions are not strong enough to replace the attractions within each substance. Students can compare how much salt, sugar, and oil dissolve in water and use the results to infer differences in particle attractions.

Saturated, Unsaturated, and Supersaturated Solutions
The amount of solute that can dissolve under specified conditions is its solubility. An unsaturated solution contains less dissolved solute than the maximum possible at a given temperature, so more solute can dissolve. A saturated solution contains the maximum amount and is in dynamic equilibrium: solute particles dissolve and crystallize at equal rates. Extra solid may remain at the bottom, but it is not part of the solution. A supersaturated solution temporarily contains more dissolved solute than a saturated solution can normally hold at that temperature. It is unstable, so adding a seed crystal or disturbing the container can cause rapid crystallization. For example, a concentrated sodium acetate solution can be heated to dissolve extra solute and then cooled carefully. When crystallization begins, solid sodium acetate forms quickly. Concentration and saturation are related, but a concentrated solution is not necessarily saturated.

Temperature and Pressure Effects
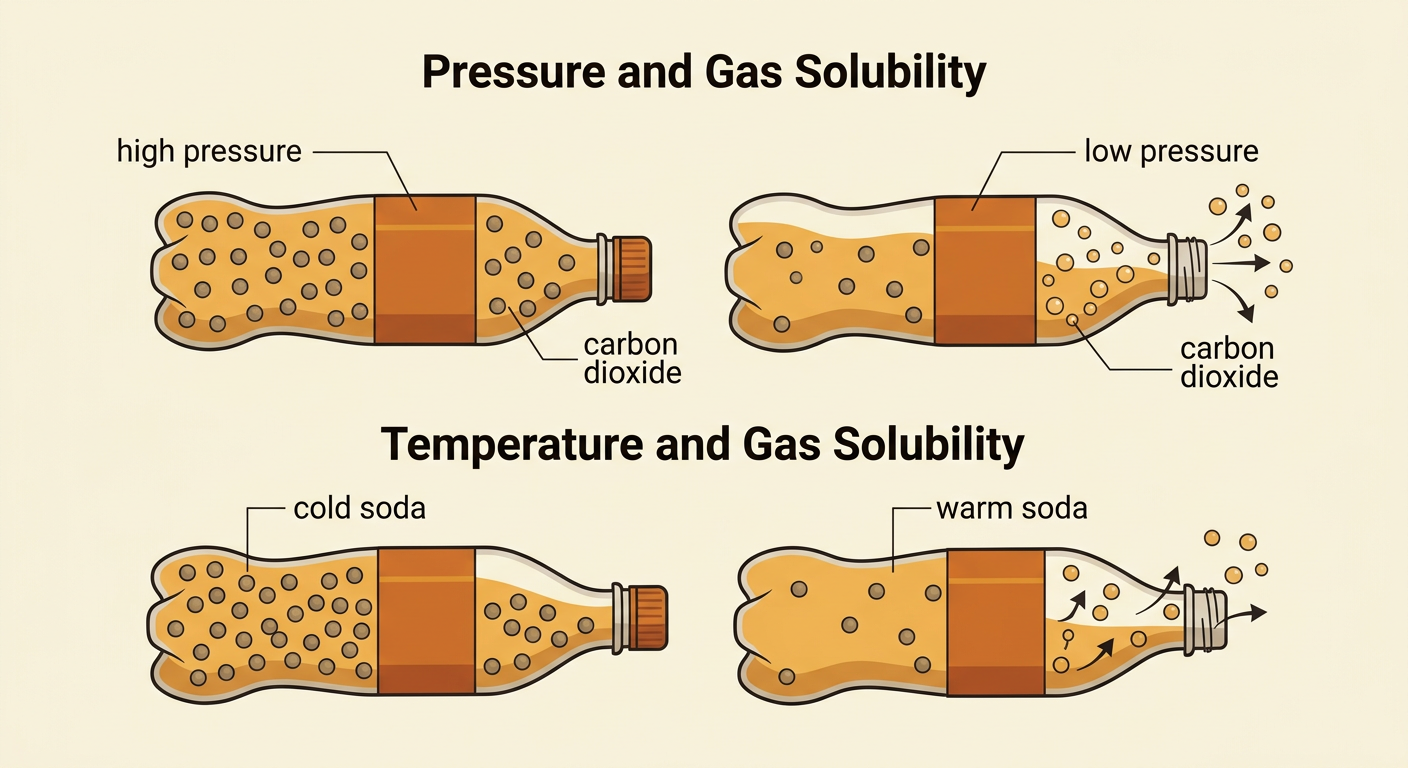
Temperature affects solubility differently for solids and gases. For many solid solutes in water, solubility increases as temperature rises because the dissolving process is favored by added thermal energy. However, this pattern is not universal, so data are needed for each substance. Gas solubility in liquids usually decreases as temperature increases because faster-moving gas particles escape more easily. Pressure has little effect on the solubility of solids and liquids, but increasing the pressure of a gas above a liquid usually increases the gas's solubility. A sealed soda bottle illustrates both effects: carbon dioxide remains dissolved under high pressure, but opening the bottle lowers the pressure and bubbles form. Warm soda loses carbon dioxide faster than cold soda. Pressure effects should be considered only when the gas is in contact with the liquid, as in the space above soda in a closed bottle.
Reading and Interpreting Solubility Curves
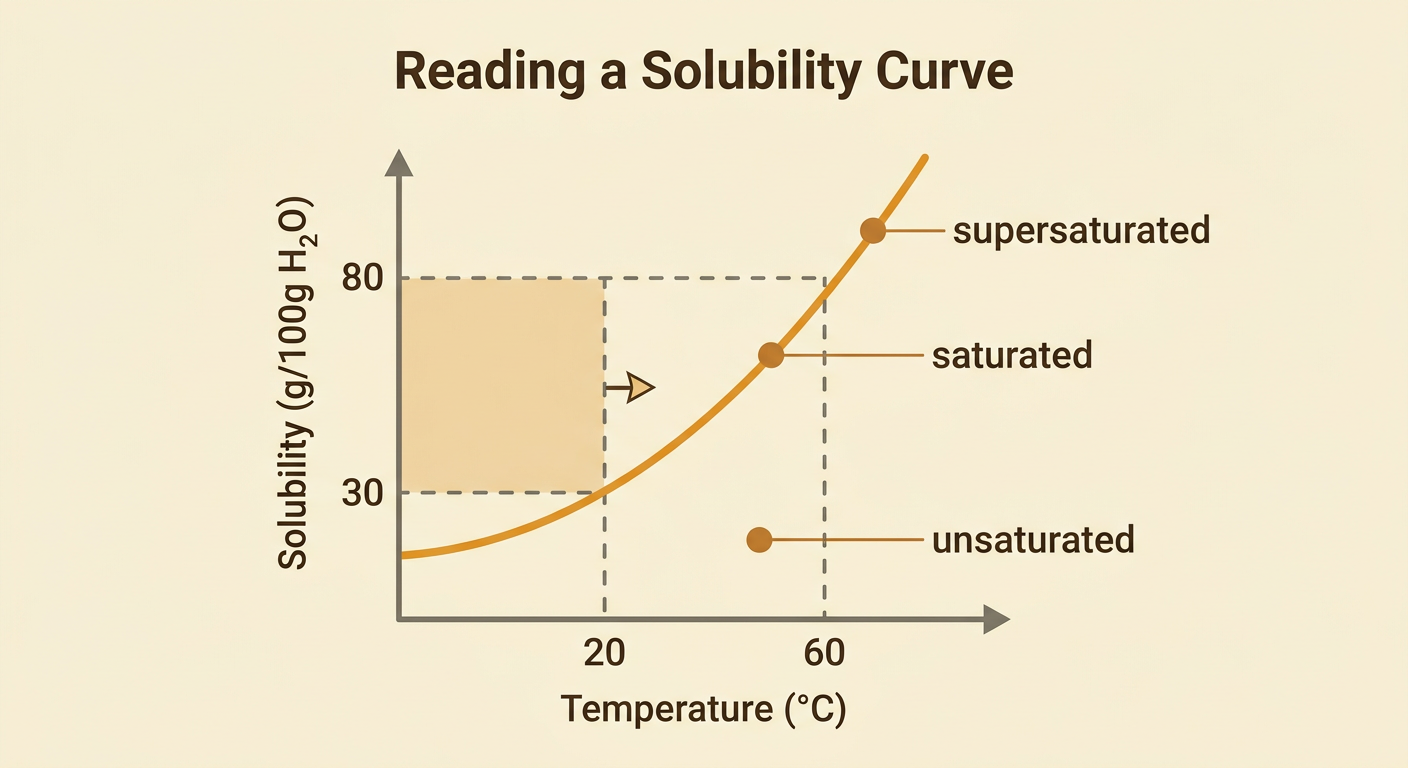
A solubility curve graphs the maximum mass of solute that dissolves in a fixed mass of solvent at different temperatures. A common graph uses temperature in degrees Celsius on the horizontal axis and grams of solute per 100 grams of water on the vertical axis. To interpret a point, first select the temperature, move vertically to the substance's curve, and then move horizontally to read the solubility. Suppose a sample substance has a solubility of 80 grams per 100 grams of water at 60 degrees Celsius but only 30 grams at 20 degrees Celsius. If a saturated solution containing 80 grams is cooled from 60 to 20 degrees Celsius, about 50 grams can crystallize, assuming no water evaporates. Points below a curve represent unsaturated solutions, points on it represent saturated solutions, and points above it indicate excess undissolved solute or a possible supersaturated solution.
Explaining Solubility with Evidence
A strong scientific explanation includes a claim, relevant evidence, and reasoning that connects the evidence to particle attractions. Students might investigate equal masses of salt, sugar, and wax placed in equal volumes of water and hexane at the same temperature. They could measure the mass that dissolves, repeat trials, and control stirring time, particle size, and temperature. A supported claim might state that sugar is more soluble in water than in hexane. The evidence would include measured solubility values and observations from repeated trials. The reasoning would explain that polar sugar molecules form stronger attractions with polar water than with nonpolar hexane. The explanation should also identify weaknesses, such as measurement uncertainty, incomplete separation of undissolved material, or too few trials. A labeled particle model or graph can translate numerical findings into visual evidence, while a written explanation states what the visual pattern means.
