
Solving Systems of Linear Equations by Graphing
Students graph two linear equations, identify their intersection as the solution to the system, and interpret cases with one, no, or infinitely many solutions.

Illustrations are auto-generated and may be placeholders. They can be refreshed to match the narration.
What Is a System of Equations?
A system of linear equations is a set of two or more linear equations that use the same variables. A solution to the system is an ordered pair that makes every equation true at the same time. For example, consider y = x + 1 and y = -x + 5. Each equation represents a straight line made of many ordered pairs. The point (2, 3) is on both lines because substituting x = 2 gives y = 3 in each equation. Therefore, (2, 3) is a solution to the system. When a system is graphed, its solution can be found by looking for points shared by both lines. Most systems of two linear equations have one shared point, no shared points, or every point in common.

Graphing Both Equations
To solve a system by graphing, draw both equations on the same coordinate plane. Begin by rewriting each equation in slope-intercept form, y = mx + b, when needed. The value b is the y-intercept, and m is the slope. For y = x + 1, plot the y-intercept (0, 1). The slope is 1, so move up 1 and right 1 to plot more points. For y = -x + 5, plot (0, 5). Its slope is -1, so move down 1 and right 1. Draw a straight line through the points for each equation. Use different colors or line styles so the graphs are easy to distinguish. Plot carefully because an inaccurate graph can suggest the wrong solution.

Finding the Point of Intersection
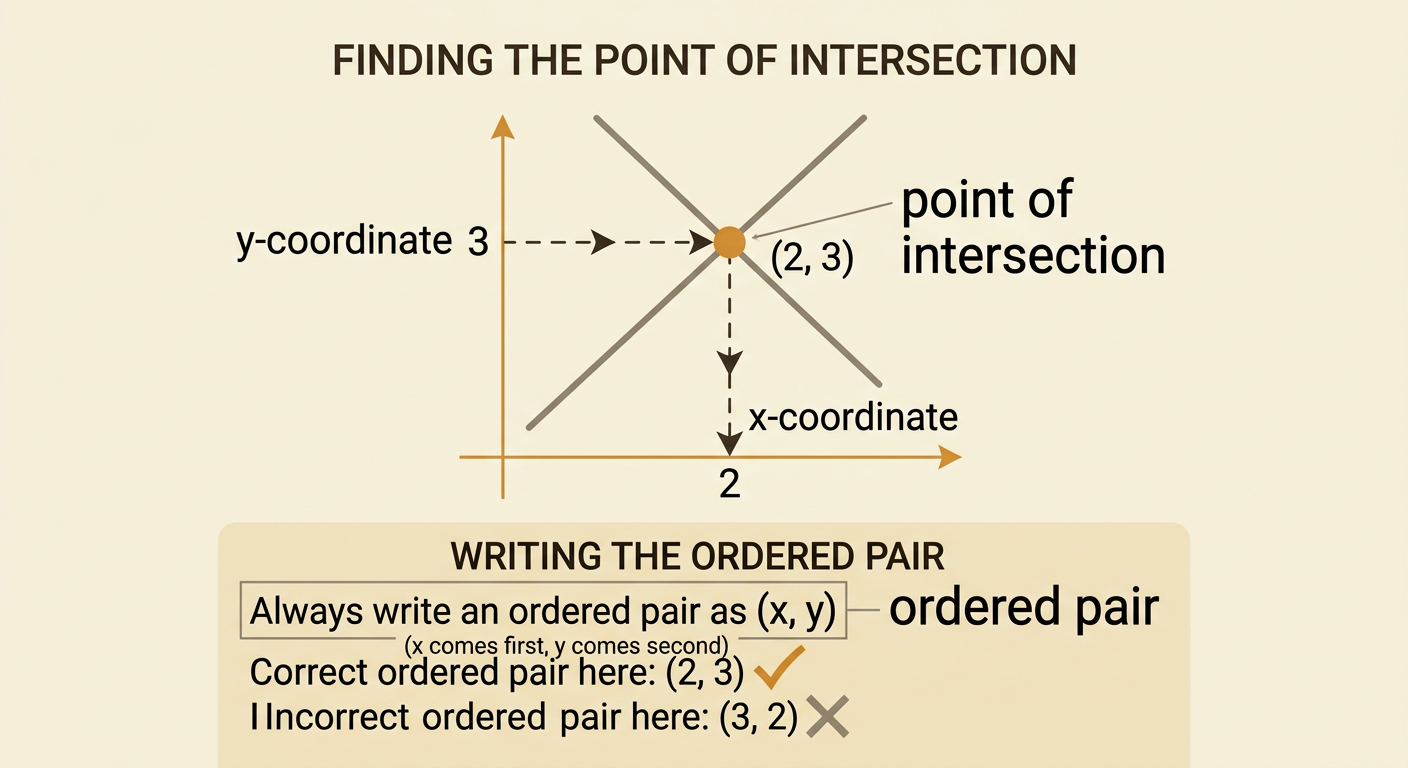
After graphing both equations, locate the point where the lines intersect. Read the x-coordinate by moving vertically from the point to the x-axis, and read the y-coordinate by moving horizontally to the y-axis. For the system y = x + 1 and y = -x + 5, the lines intersect at (2, 3). This means x = 2 and y = 3 satisfy both equations. Always write the solution as an ordered pair, with the x-value first and the y-value second. If the intersection falls between grid lines, graphing may provide only an estimate. In that situation, use a finer scale or check the point algebraically to determine whether the coordinates are exact.
Checking the Solution
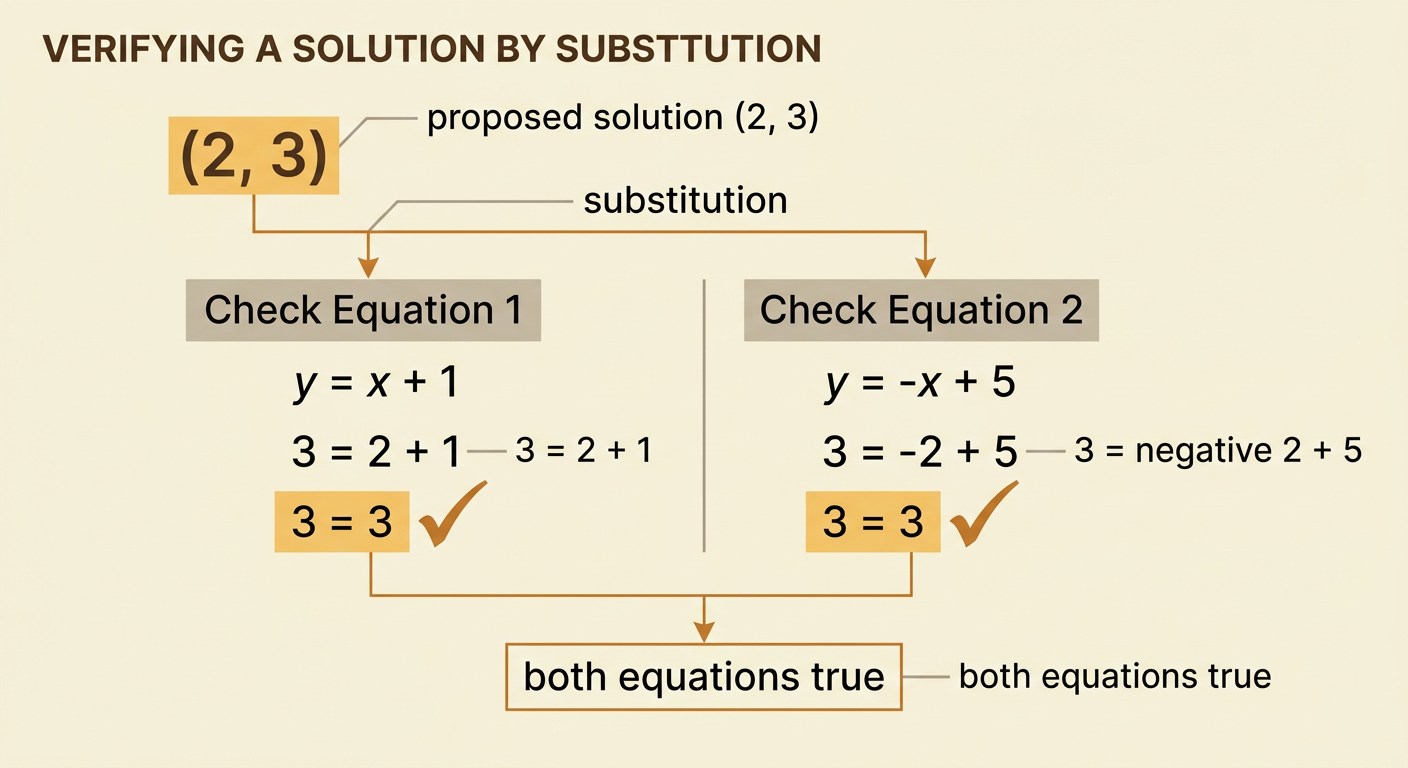
A graph can contain small drawing or reading errors, so check the solution by substituting its coordinates into both original equations. For the proposed solution (2, 3), substitute x = 2 and y = 3 into y = x + 1. The result is 3 = 2 + 1, which is true. Then substitute the same values into y = -x + 5. The result is 3 = -2 + 5, which is also true. Because the ordered pair makes both equations true, it is the solution to the system. If the pair works in only one equation, it is not a solution. A system’s solution must satisfy all equations simultaneously.
One, No, or Infinitely Many Solutions
The graphs of two linear equations reveal how many solutions a system has. If two lines have different slopes, they intersect once, so the system has one solution. For example, y = x + 1 and y = -x + 5 intersect at (2, 3). If two distinct lines have the same slope, they are parallel and never intersect, so the system has no solution. For example, y = 2x + 1 and y = 2x - 3 have equal slopes but different y-intercepts. If two equations graph as the same line, every point on that line satisfies both equations, so the system has infinitely many solutions. For example, y = 2x + 1 and 2y = 4x + 2 are equivalent equations. Slope and y-intercept can help you predict each case before graphing.
