Sort It! Making a Class Data Table
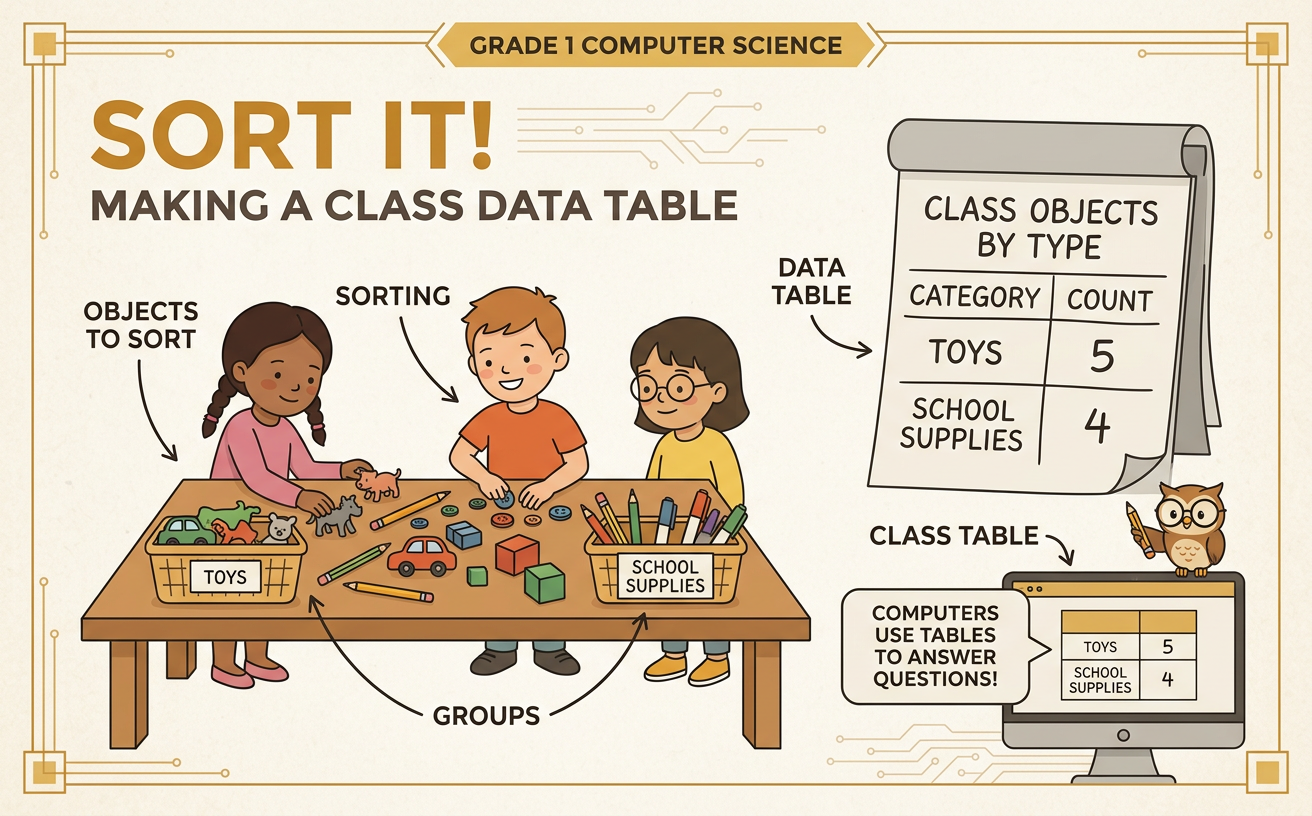
Students sort classroom objects by one attribute, record the groups in a simple table, and explain how organized data helps people and computers answer questions.
Illustrations are auto-generated and may be placeholders. They can be refreshed to match the narration.
What Is Data?
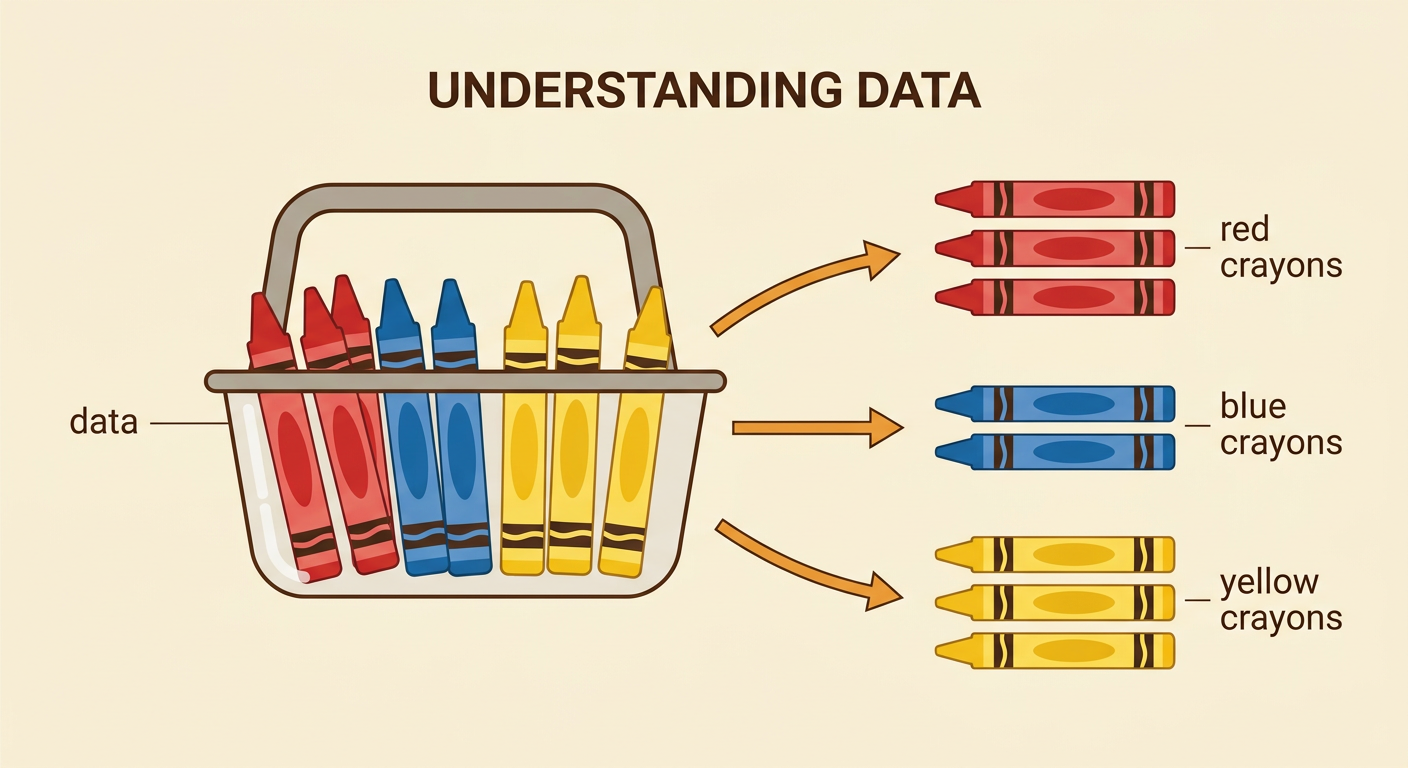
Data is information we collect to help answer questions. We can collect data about objects in our classroom. Imagine that a basket holds eight crayons. Three crayons are red, two are blue, and three are yellow. The crayon colors and the number of crayons of each color are data. We can organize this information so it is easy to understand. Organized data helps us answer questions such as, “How many crayons are blue?” It can also help a computer count, compare, and find patterns. Before collecting data, decide what you want to learn. You might ask, “What colors are the crayons in our basket?” Then look carefully at each crayon and record what you find.
Choose a Sorting Rule
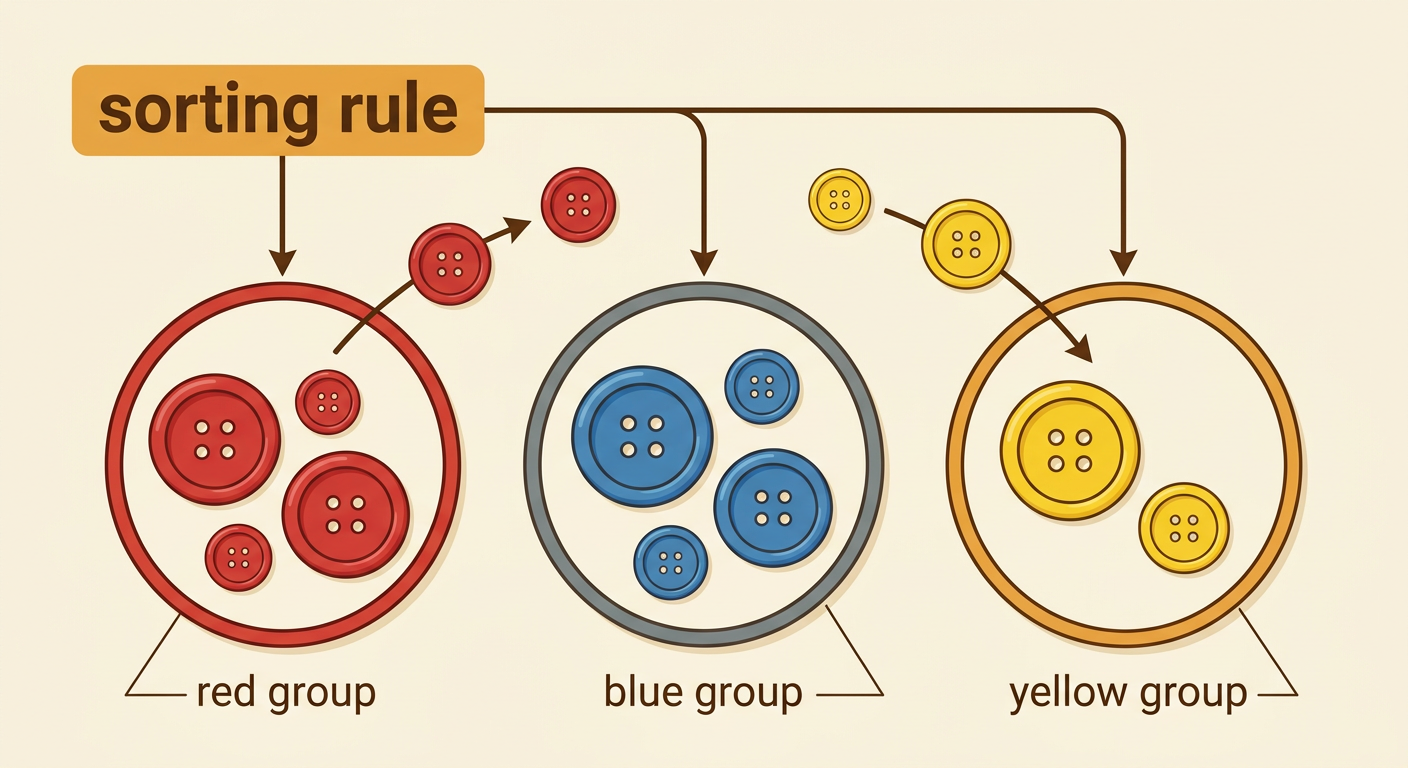
A sorting rule tells how objects will be grouped. Choose one attribute, or feature, that you can see or describe. Color, shape, and size are examples of attributes. Suppose you have nine classroom buttons. You decide to sort them by color. Your rule is, “Put each button in the red, blue, or yellow group.” Follow only that rule. Do not sort some buttons by color and other buttons by size. A large red button and a small red button belong together because both are red. A clear rule makes each group easy to understand. It also helps another person or a computer follow the same steps and get the same groups.
Sort the Classroom Objects
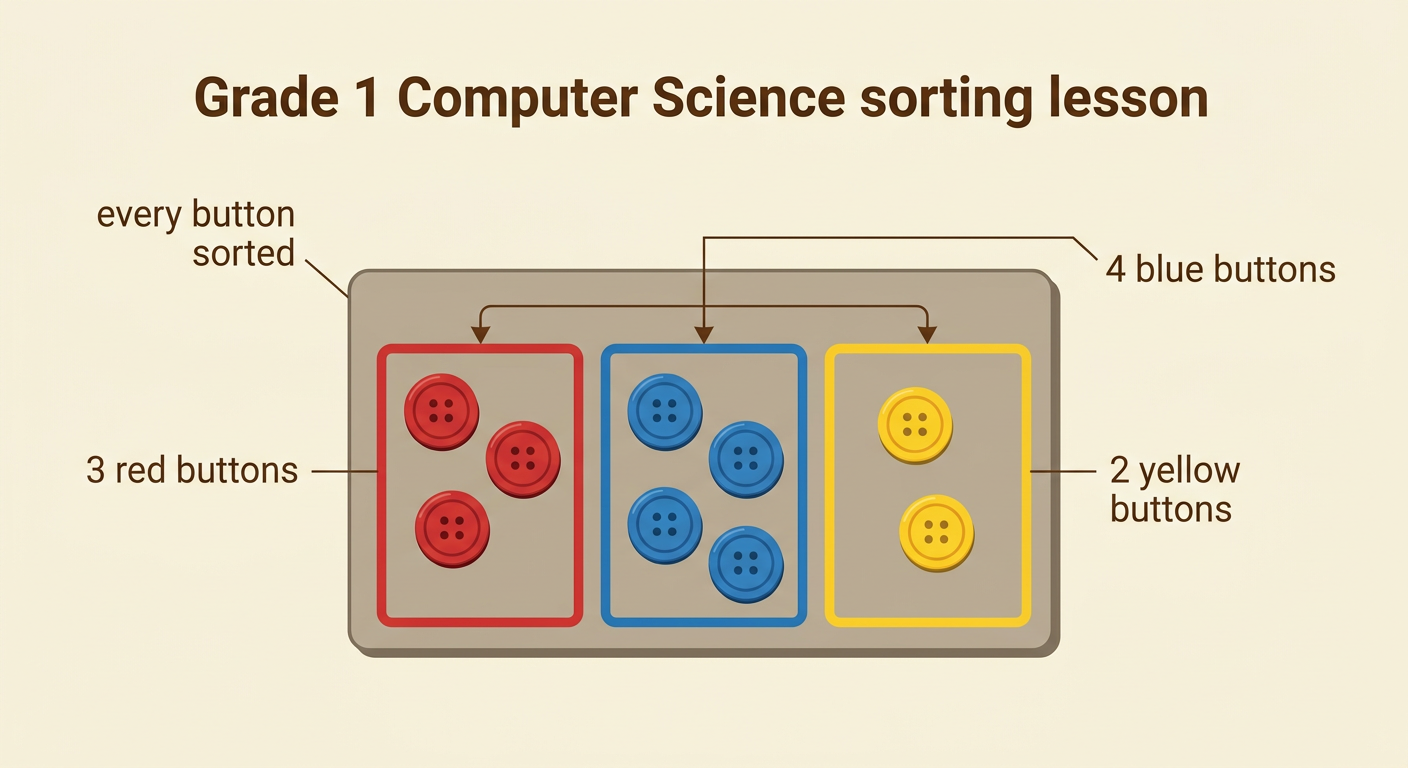
Now use the sorting rule to place each object in one group. Let us sort nine buttons by color. Look at one button at a time. Put a red button in the red group, a blue button in the blue group, or a yellow button in the yellow group. Continue until every button has been placed. Then check your work. Each button should be in exactly one group, and no button should be left out. In this example, the red group has three buttons, the blue group has four buttons, and the yellow group has two buttons. Count each group again to make sure. Careful sorting gives us accurate data, which means the information matches the objects.
Build a Data Table
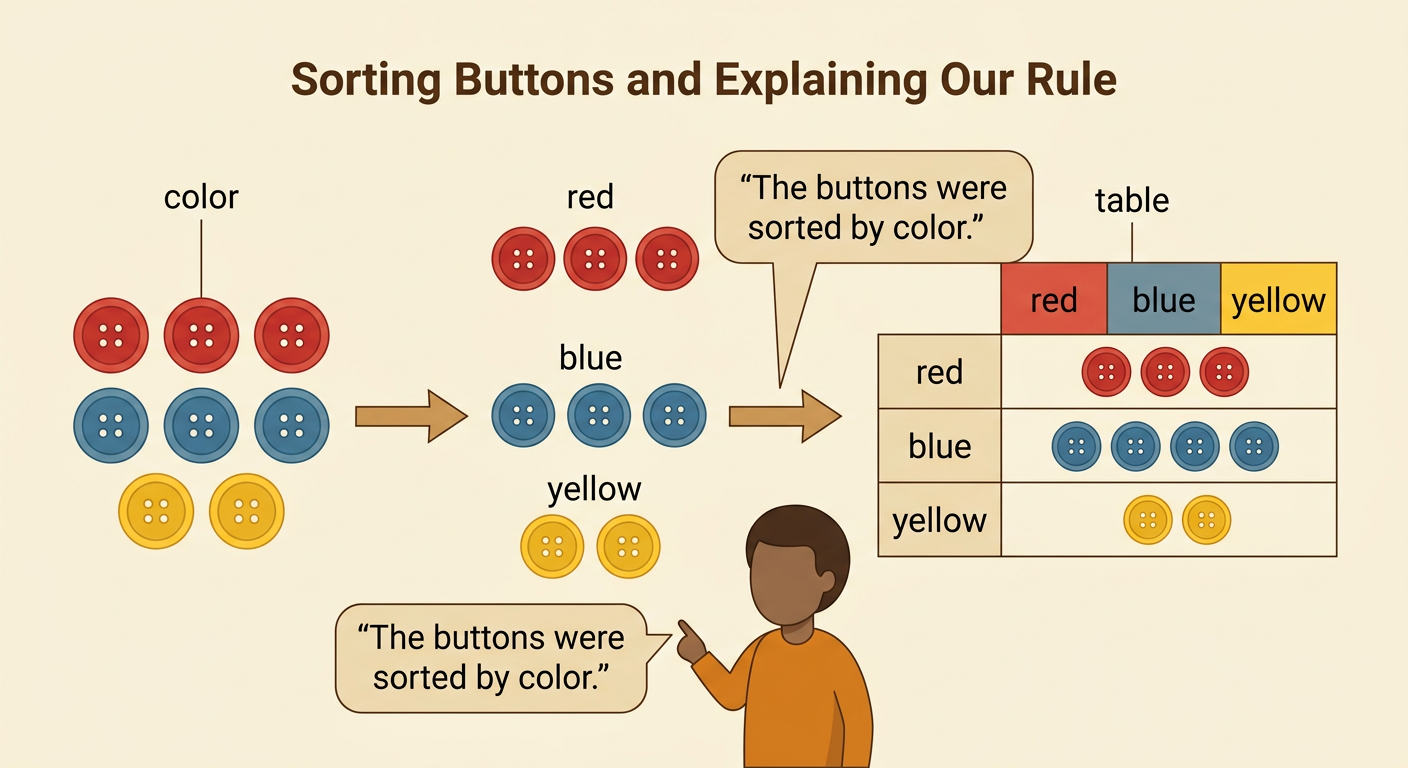
A data table organizes information in rows and columns. Make one row for each color group. Write the category name in the first column and the number of objects in the second column. For our buttons, write Red and 3 in the first row, Blue and 4 in the second row, and Yellow and 2 in the third row. The words tell what the categories are. The numbers tell how many buttons are in each category. Check the table by matching each number to the sorted group. You can also add the counts: 3 plus 4 plus 2 equals 9. This total matches the nine buttons we sorted. A simple table helps people and computers read the data quickly.

Ask and Answer Data Questions
Use the table to ask and answer questions about the buttons. First, find information in the correct row. How many blue buttons are there? The Blue row shows 4. How many buttons are there in all? Add the category counts: 3 plus 4 plus 2 equals 9. You can also compare categories. Are there more blue buttons or yellow buttons? There are more blue buttons. How many more? Match two yellow buttons with two blue buttons. Two blue buttons are left, so there are 2 more blue buttons than yellow buttons. You can say the same comparison another way: there are 2 fewer yellow buttons than blue buttons. Organized data makes these answers easier to find and check.

Explain the Sorting Rule
After sorting, explain your rule so someone else can understand your data. Use a complete sentence such as, “I sorted the buttons by color into red, blue, and yellow groups.” Then tell how you handled each object: “I looked at the color of every button and put it in one group.” You can also share the results: “There are three red buttons, four blue buttons, and two yellow buttons.” A good explanation names the attribute, the categories, and the group counts. It should match the table. Clear directions help another student repeat the sort. They also help a computer use the correct categories. If you sorted by shape instead, you would need new category names and a new table.