
Sort Materials in a Digital Data Table
Students classify classroom materials by observable properties, enter the results into a digital table, sort the data, and vote on how the materials could be reused or recycled.
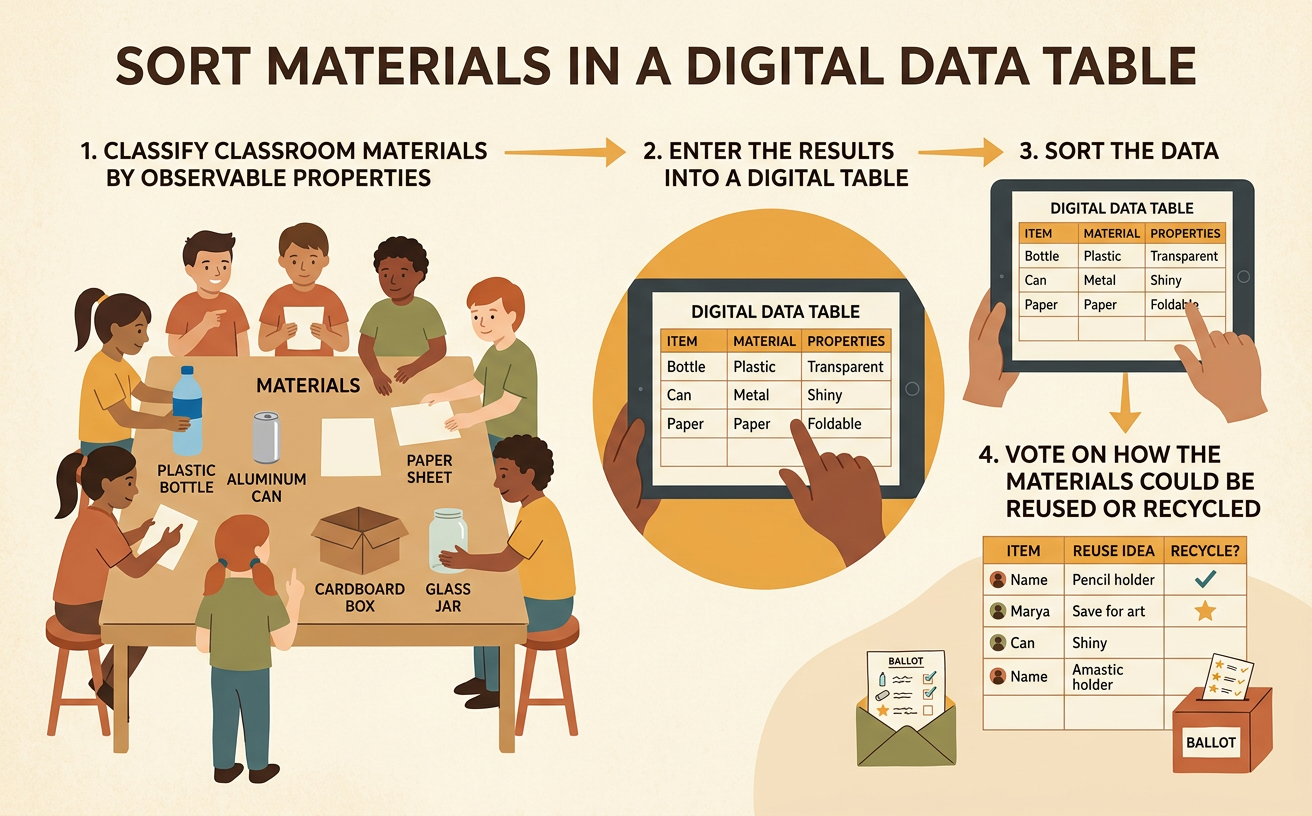
Illustrations are auto-generated and may be placeholders. They can be refreshed to match the narration.
Explore Material Properties
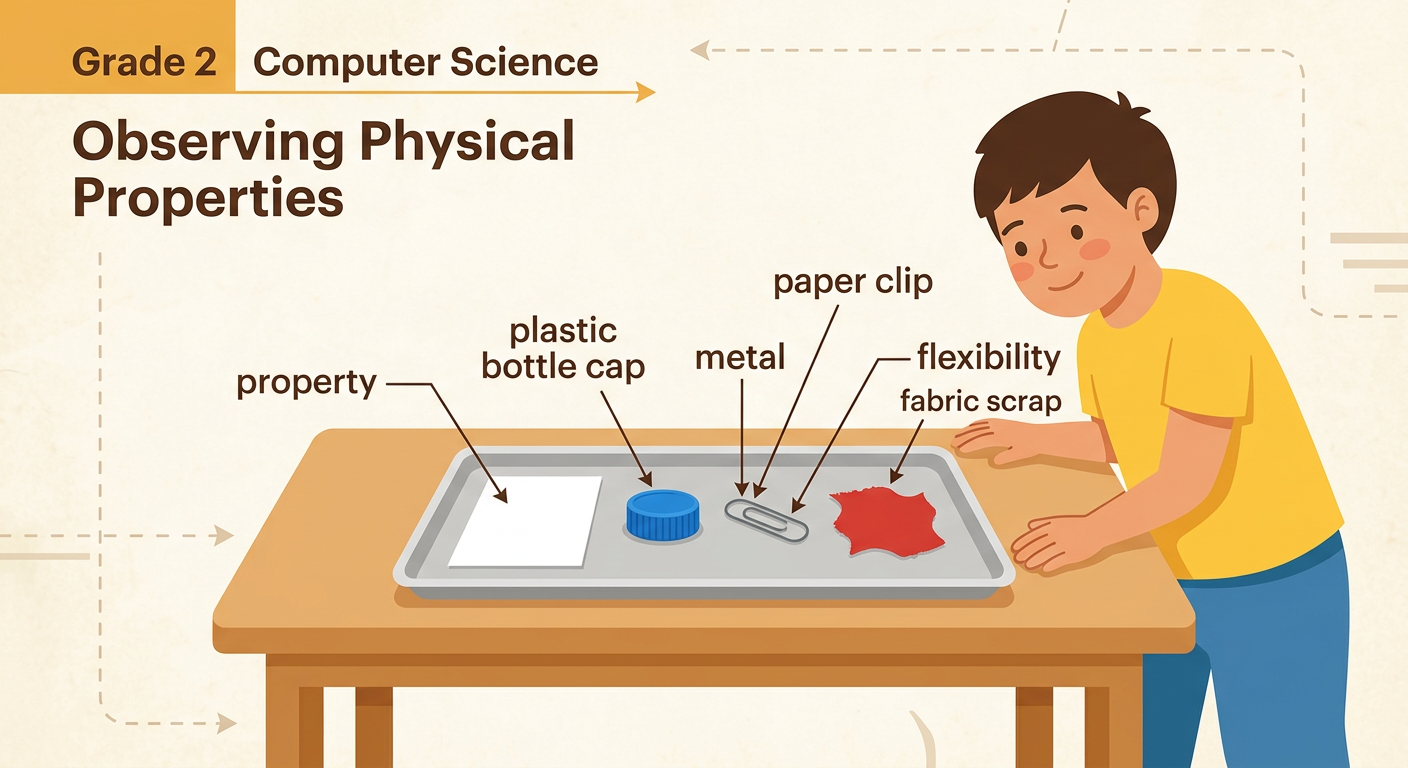
Look closely at several classroom objects, such as a paper sheet, a plastic bottle cap, a metal paper clip, and a fabric scrap. A property is something you can observe without changing the material. You can describe color, texture, shape, hardness, flexibility, or what the object is made from. Use safe actions to investigate. Look at each object, gently touch it, and bend it only if your teacher says it is safe. For example, a paper clip is made of metal. It is smooth, hard, and slightly flexible. A fabric scrap may be soft, bendable, and rough or smooth. Students may notice different properties, so listen to one another and use clear evidence. Record only what you can observe. Do not guess about a property that you did not test.
Choose Data Categories
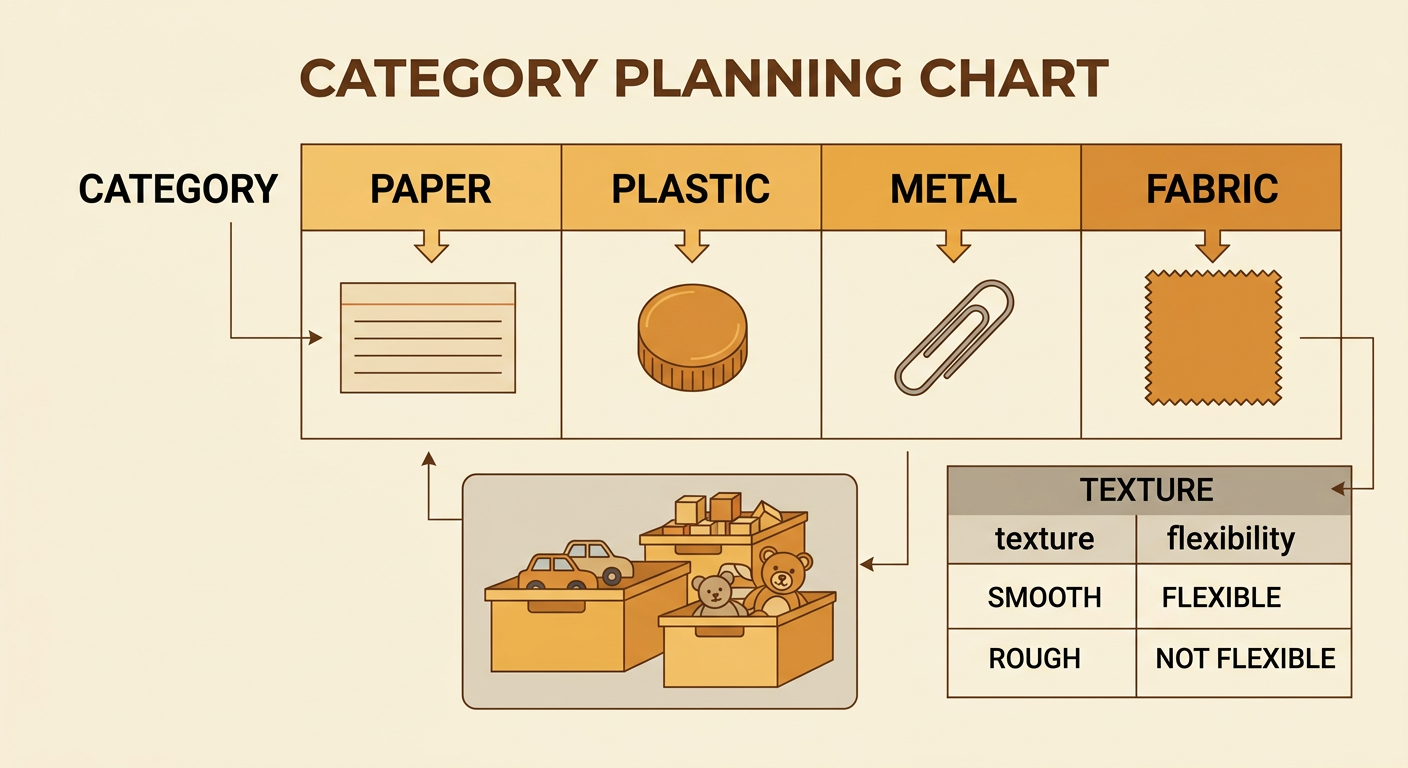
A category is a group used to organize information. Before entering data, decide which categories will answer your class question. If the question is “What are our objects made from?” use material categories such as paper, plastic, metal, and fabric. These four categories do not overlap for the objects in this investigation. You can also create table columns for other observable properties, such as color, texture, and flexibility. Agree on words everyone will use. For texture, the class might choose only “smooth” or “rough.” For flexibility, choose “flexible” or “not flexible.” Clear category names make the data easier to sort and compare. For example, place a cardboard note card in the paper category and describe its texture as smooth. Ask whether every object can be entered using the chosen choices. If not, revise the categories together.
Enter Data in a Digital Table
A digital data table stores information in rows and columns. Open the teacher-approved table on a computer or tablet. Each row represents one object. Each column represents one kind of information, such as object name, material, color, texture, and flexibility. Click or tap a cell, then type the observation. Enter one fact in each cell. For example, the row for “bottle cap” might show “plastic,” “blue,” “smooth,” and “not flexible.” Check your spelling and make sure the information is in the correct column. Do not leave a cell blank if you made that observation. Save the table after entering the records. Work with a partner to compare each digital row with the real object. Accurate entries matter because the computer will use the table data when you sort and count the records.

Sort and Compare the Records
Sorting rearranges records according to a chosen column. It does not erase the information. Select the “Material” column and use the sort tool so matching materials appear together. All paper records will be near one another, followed by other groups according to the program’s order. Count the records in each material group. For example, your table might contain four paper objects, three plastic objects, two metal objects, and one fabric object. Compare the counts using words such as more, fewer, equal, most, and least. Paper has one more object than plastic, and fabric has the fewest objects. You can sort again by texture to place smooth and rough objects together. Check that every original row is still present after sorting. Sorting helps people find patterns quickly, but it does not change an object’s properties or category.

Create a Picture Graph
Use the category counts from the sorted table to make a picture graph. Give the graph a clear title, list up to four material categories, and include a key. For a single-unit picture graph, let one picture stand for one object. If the table shows four paper objects, three plastic objects, two metal objects, and one fabric object, draw that many matching symbols in each row. The paper row gets four symbols. The fabric row gets one symbol. Check that the graph and digital table show the same totals. Then answer questions using the graph. Which category has the most objects? Paper has the most. How many more paper objects are there than metal objects? Four minus two equals two. A picture graph turns table data into a display that makes amounts easy to see and compare.

Vote on Reuse or Recycling
Use the data to decide how the class could reduce waste. First, discuss safe and realistic choices for each material. A clean paper sheet with an unused side could become drawing paper. A clean plastic cap might be reused for a teacher-approved art project. Metal and plastic items may be recycled only if local rules accept them. Fabric scraps could be saved for crafts. Listen without interrupting, explain your reasons, and work toward choices the group can support. Then hold a fair vote on one class action, such as making a scrap-paper drawing bin. Each student gets one vote. Count the votes and record the result in the digital table or on a single-unit bar graph. The choice with the most votes becomes the class action if it is safe and allowed. Plan who will help, what supplies are needed, and when the action will begin.
