
Sound Wave Amplitude and Community Noise
Students examine waveform models and community sound data to determine how amplitude relates to sound energy and how sound levels vary among places.
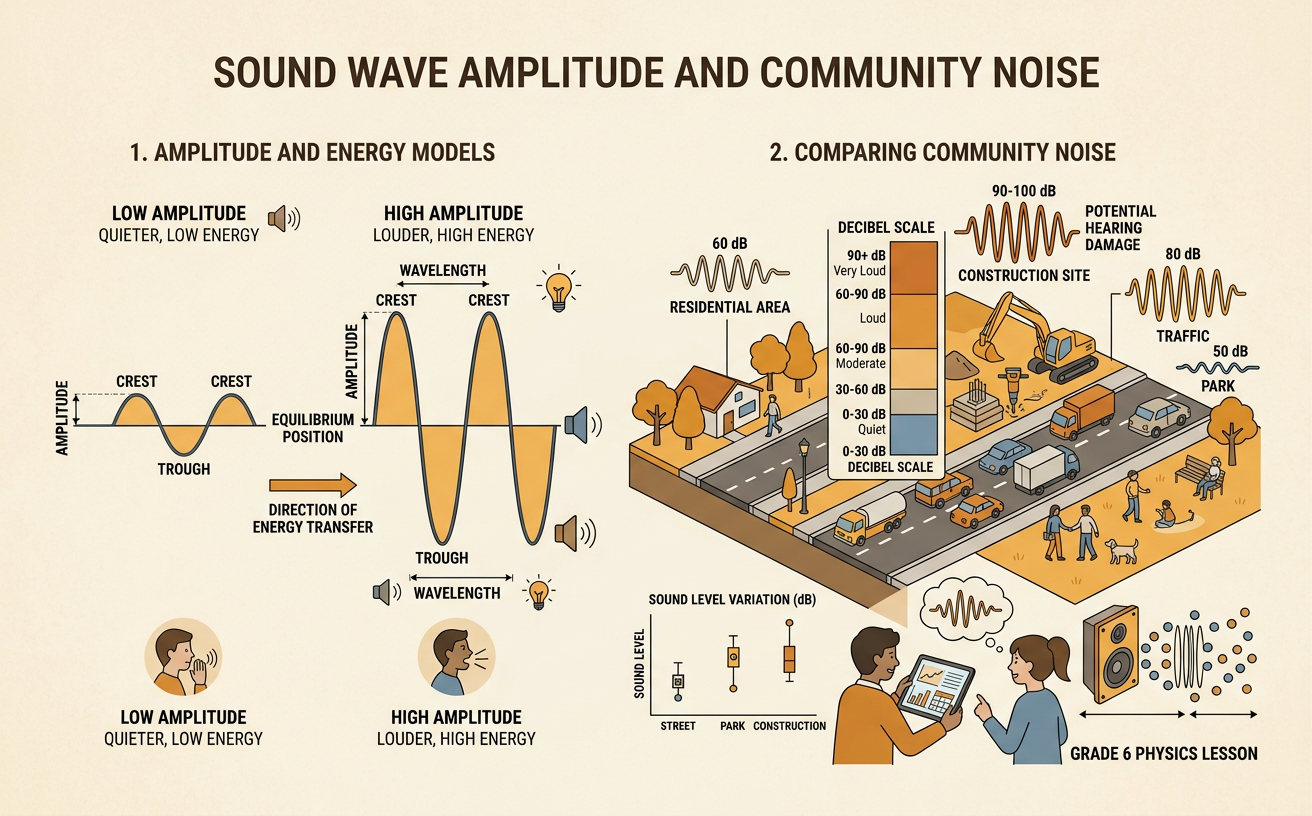
Illustrations are auto-generated and may be placeholders. They can be refreshed to match the narration.
What Makes a Sound Wave?
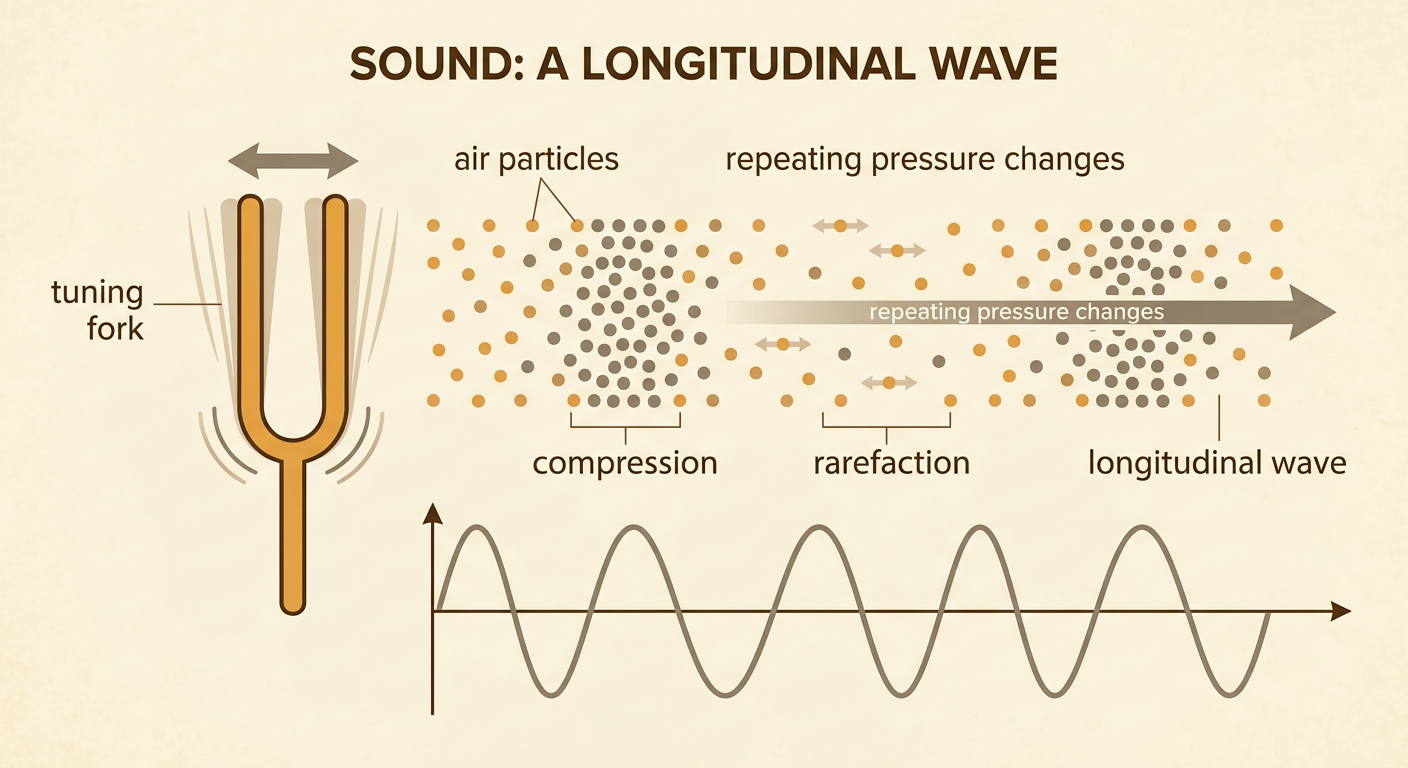
Sound begins when an object vibrates. The vibration pushes and pulls nearby particles in a medium such as air, water, or a solid. In air, particles crowd together in compressions and spread apart in rarefactions. These repeating pressure changes travel outward as a longitudinal sound wave. The particles move back and forth around their positions; they do not travel all the way from the source to the listener. For example, when a tuning fork is struck, its prongs vibrate and create pressure changes in the surrounding air. A waveform is a model of these changes. Its horizontal axis can represent time or distance, while its vertical axis can represent pressure change or particle displacement. The model helps us see patterns that are difficult to observe directly.
Comparing Wave Amplitudes
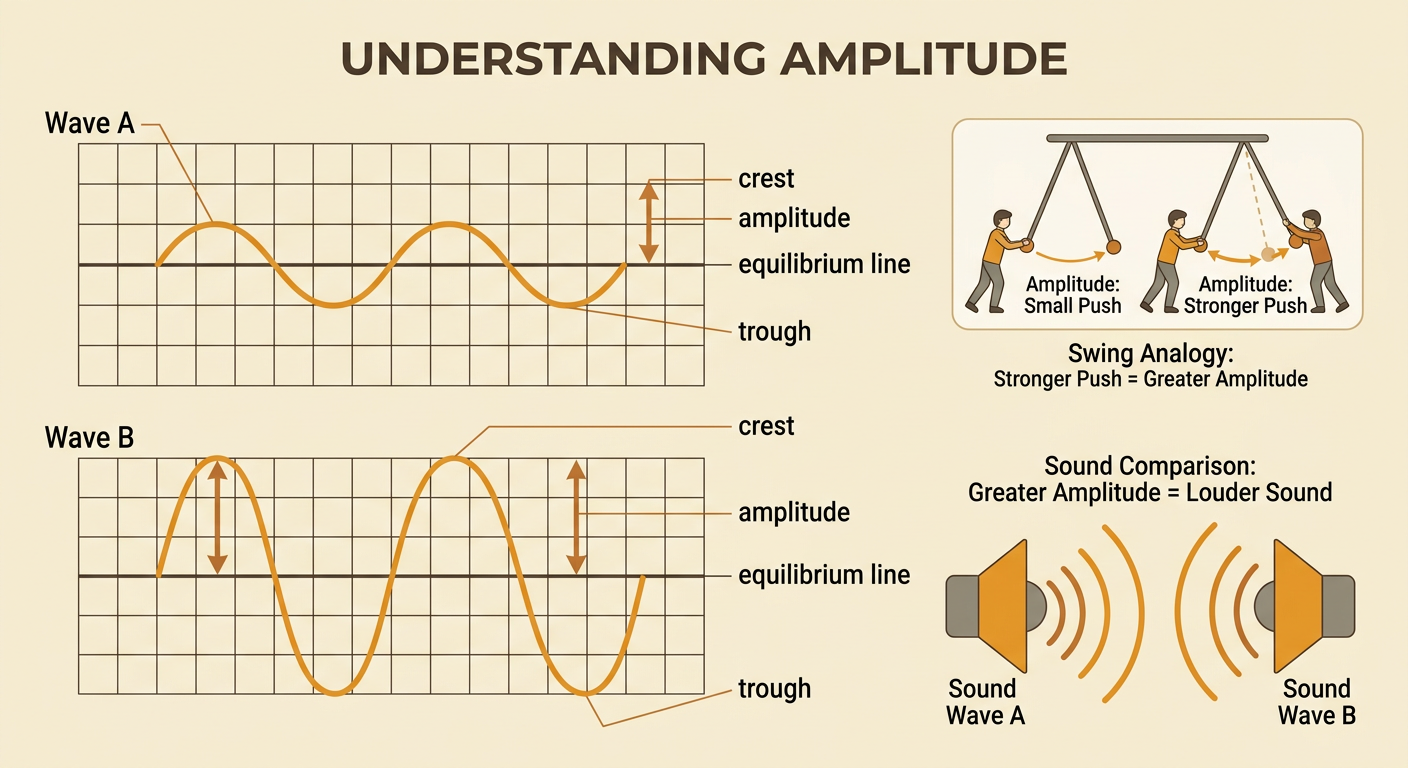
Amplitude describes the greatest change from a wave’s equilibrium, or middle, position. On a waveform, measure amplitude vertically from the equilibrium line to a crest or to a trough. Do not measure from a crest all the way to a trough because that distance equals two amplitudes. Waves can have the same wavelength and frequency but different amplitudes. For example, suppose Wave A has an amplitude of 2 millimeters and Wave B has an amplitude of 6 millimeters. The ratio is 6 to 2, or 3 to 1, so Wave B’s amplitude is three times Wave A’s amplitude. Under the same conditions, a sound wave with greater amplitude usually produces a louder sound. Frequency is different from amplitude: frequency affects pitch, while amplitude is related to sound level and energy.
Amplitude and Sound Energy
A sound wave carries energy through a medium. For waves compared under the same conditions, the energy carried is proportional to the square of the amplitude. This means that energy changes faster than amplitude. A useful model is energy proportional to amplitude times amplitude. If amplitude doubles, the energy factor is 2 times 2, or 4. If amplitude triples, the energy factor is 3 times 3, or 9. For example, compare a wave with an amplitude of 1 unit to a wave with an amplitude of 3 units. The second wave has three times the amplitude but carries nine times as much energy in this model. This relationship applies when other factors, such as the medium and the way amplitude is measured, stay the same.

Reading Community Sound Data
Community sound levels are often measured with a sound-level meter and reported in decibels, written dB. The decibel scale is logarithmic, so equal increases in decibels do not represent equal additions of sound intensity. An increase of 10 dB represents about 10 times the sound intensity. Imagine measurements taken for one minute at the same time of day: a library is 45 dB, a park is 55 dB, a busy road is 65 dB, and a construction site is 75 dB. The road is 10 dB above the park, so its measured intensity is about 10 times as great. The construction site is 30 dB above the library, corresponding to about 1,000 times the intensity. Fair comparisons require the same equipment, measurement duration, distance from sources, and similar weather conditions.

Designing a Community Noise Map
A community noise map connects sound data to location. Begin with a simple base map showing roads, buildings, parks, and other important features. Choose several safe measurement sites and collect data with the same method at each site. For example, a class might visit six sites, record a one-minute sound level at each, and mark every value beside its location. A legend can group results into quieter, moderate, and louder ranges. The completed map may show higher levels near a highway or outdoor concert area and lower levels near a tree-filled park. Cultural characteristics, such as festivals, sports, or transportation habits, can affect sound patterns. Environmental characteristics, including hills, trees, wind, and building arrangement, can also change how sound travels. Patterns suggest useful questions, but more evidence is needed before claiming that one feature caused a sound level.
