
Statistical Inference and Confidence Intervals
Students use sample data to estimate population parameters, interpret margins of error, and evaluate conclusions from statistical studies.
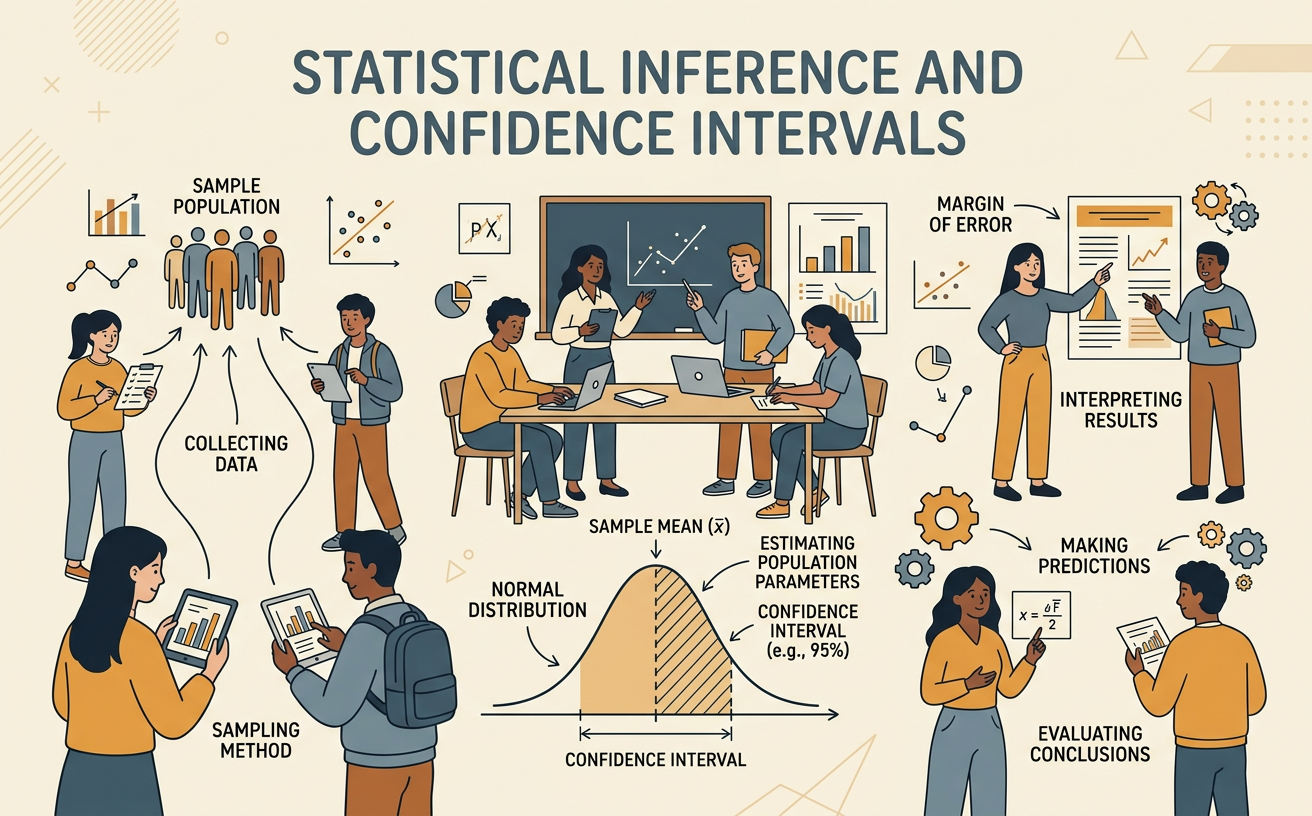
Illustrations are auto-generated and may be placeholders. They can be refreshed to match the narration.
Population and Sample
A population is the entire group researchers want to understand, while a sample is the smaller group from which data are actually collected. A population parameter is a numerical description of the population, such as its true mean or proportion. A sample statistic describes the sample and is used to estimate that unknown parameter. For example, a school district wants to know the mean number of hours its 8,000 high school students sleep each night. Surveying every student may be impractical, so researchers question 200 students. The 8,000 students form the population, and the 200 surveyed students form the sample. If the sample mean is 7.1 hours, then 7.1 is a statistic used to estimate the unknown population mean. The quality of this estimate depends on how the sample was selected and how much natural variation exists among possible samples.
Random Sampling
A random sample is selected by a method that gives each member of the population a known chance of being chosen. Random selection helps produce a representative sample and reduces selection bias, although it does not guarantee that every sample will perfectly match the population. For example, suppose a school wants to estimate the proportion of 1,200 juniors who support a later start time. Administrators assign each junior a number from 1 to 1,200 and use a random number generator to select 100 different numbers. Every junior has an equal chance of selection. Surveying only students who arrive early would be biased because those students may have different opinions about start times. Random sampling allows probability models and simulations to describe sampling variability, which is the expected difference among statistics calculated from repeated random samples.
Point Estimates
A point estimate is a single sample statistic used to estimate a population parameter. The sample mean estimates a population mean, and the sample proportion estimates a population proportion. Suppose 138 of 200 randomly selected voters say they support a proposed park. The sample proportion is 138 divided by 200, or 0.69. Therefore, 69% is the point estimate for the proportion of all voters who support the proposal. This number is useful, but it is unlikely to equal the population proportion exactly because another random sample could produce a different result. Larger random samples generally produce point estimates with less sampling variability than smaller random samples. A point estimate should therefore be reported with information about its uncertainty, usually a margin of error or confidence interval, rather than treated as a perfectly precise description of the population.
Margin of Error
A margin of error describes how far a sample estimate is expected to be from the population parameter at a stated confidence level. It reflects random sampling variability, not every possible source of error. Researchers can develop it through simulation by repeatedly taking random samples of the same size from a model population and recording each sample statistic. For example, suppose a sample survey estimates that 54% of students prefer online textbooks. A simulation of many random samples shows that about 95% of sample proportions fall within 4 percentage points of the model’s population proportion. The estimated margin of error is then 4 percentage points. The result may be reported as 54% plus or minus 4 percentage points. Increasing the sample size usually decreases the margin of error because statistics from larger samples vary less. Bias from misleading questions or poor sampling is not corrected by a margin of error.
Confidence Intervals
A confidence interval combines a point estimate with a margin of error to give a plausible range for a population parameter. It is calculated as estimate minus margin of error to estimate plus margin of error. If 54% of sampled students prefer online textbooks and the margin of error is 4 percentage points, the interval is 50% to 58%. A correct interpretation is that researchers are 95% confident that the true population proportion lies between 50% and 58%, assuming the sampling method and model are appropriate. The 95% confidence level refers to the long-run success rate of the method: if researchers repeatedly took random samples and constructed intervals in the same way, about 95% of those intervals would contain the true parameter. It does not mean that 95% of individual students have preferences between 50% and 58%.
Evaluating Conclusions
A statistically reasonable conclusion depends on more than the reported interval. Check whether the sample was randomly selected, whether the sample represents the target population, whether the questions were neutral, and whether nonresponse or other bias could affect the results. Also distinguish an observational survey from an experiment: a survey can describe an association or estimate a parameter, but it generally cannot establish cause and effect. For example, a voluntary online poll of 600 website visitors reports that 72% support a new city stadium, with a stated margin of error of 3 percentage points. The large sample does not make the conclusion reliable because visitors chose whether to participate and may not represent all city residents. The stated margin of error addresses random sampling variability, not voluntary-response bias. A careful evaluation would reject the claim that 69% to 75% of all residents support the stadium.