
Staying in Balance: Feedback Loops and Homeostasis
Students analyze blood glucose regulation to explain how negative feedback mechanisms maintain stable internal conditions despite environmental or behavioral changes.
Illustrations are auto-generated and may be placeholders. They can be refreshed to match the narration.
What Is Homeostasis?
Homeostasis is the process by which an organism keeps internal conditions within ranges that allow cells to function. The body does not hold each condition at one exact value. Instead, it continually makes adjustments around a normal range as the external environment and behavior change. Body temperature, blood pH, water balance, and blood glucose are regulated this way. For example, during a run on a hot day, muscles produce heat and the environment may add more heat. Temperature sensors signal the brain, which increases sweating and blood flow near the skin. These responses release heat and help return body temperature toward its normal range. Homeostasis is dynamic: conditions may rise or fall temporarily, but regulatory systems resist changes that could disrupt cell function.

The Parts of a Feedback Loop
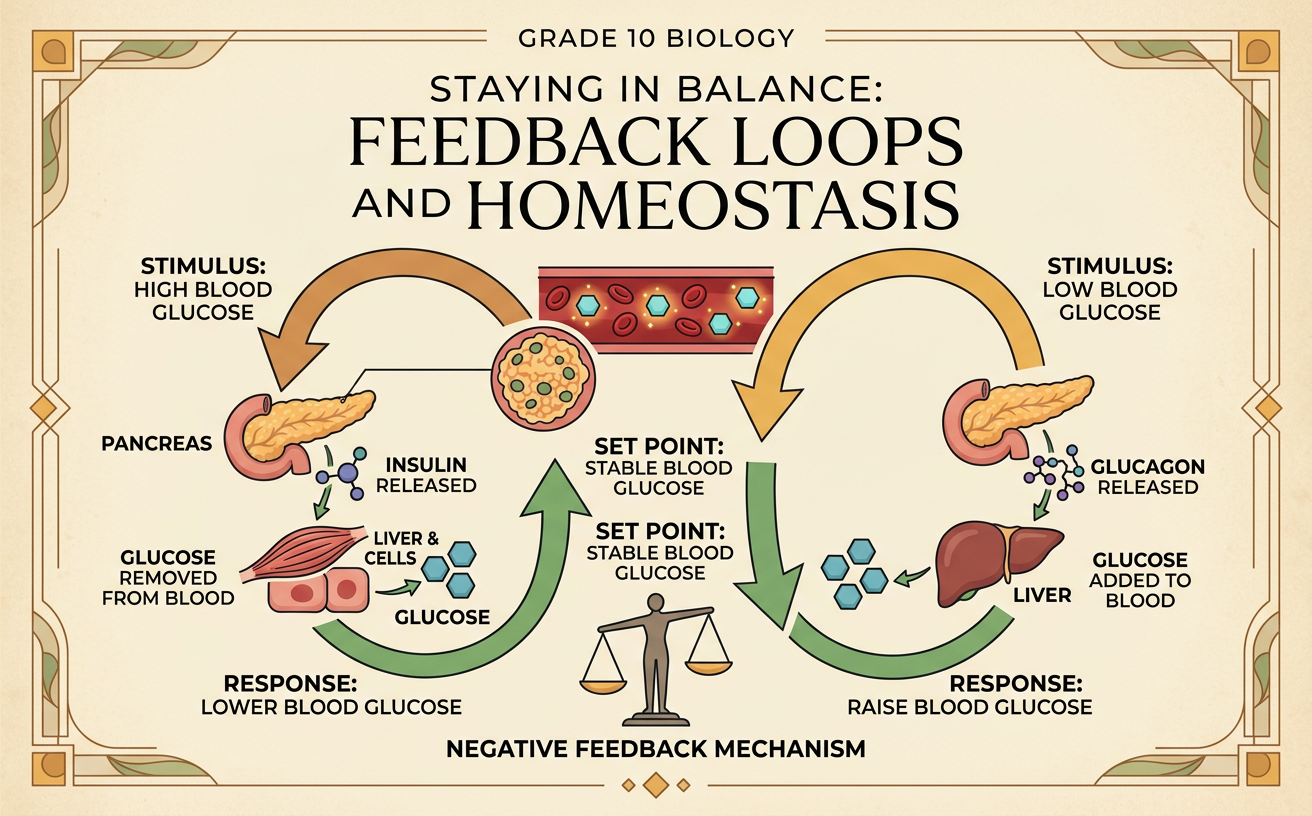
A feedback loop includes a stimulus, a sensor, a control center, an effector, and a response. A stimulus changes an internal condition. A sensor detects the change and sends information to a control center, which compares the condition with its regulated range. The control center signals an effector, such as a muscle, gland, or organ. The effector produces a response. In negative feedback, the response reduces the original change. For example, if body temperature falls in cold air, temperature receptors detect the decrease. The brain activates skeletal muscles to shiver, producing heat that raises temperature toward the normal range. As temperature recovers, the signal for shivering decreases. This self-limiting pattern prevents the response from continuing after the disturbance has been corrected.

Blood Glucose Regulation
Glucose is a major fuel for cellular respiration, but too much or too little glucose in the blood can be harmful. After a carbohydrate-rich meal, digestion releases glucose into the bloodstream. Rising blood glucose stimulates beta cells in the pancreas to release insulin. Insulin promotes glucose uptake by many body cells and encourages the liver and muscles to store glucose as glycogen. Blood glucose then falls toward its regulated range. Between meals, falling blood glucose stimulates pancreatic alpha cells to release glucagon. Glucagon signals the liver to break down glycogen and make and release glucose. Blood glucose then rises toward the regulated range. These opposing pathways form negative feedback loops. For example, insulin activity after breakfast limits the increase in blood glucose while still making fuel available to cells.

Interpreting a Glucose Graph
A glucose graph turns measurements into evidence about regulation. Time belongs on the horizontal axis, and blood glucose concentration belongs on the vertical axis. First identify the baseline, or the value before a disturbance. Then locate the peak or lowest point, calculate the size of the change, and determine how long recovery takes. Suppose a graph begins at 90 milligrams per deciliter before lunch, rises to 145 after the meal, and returns near 90 within about two hours. The 55-milligram-per-deciliter increase shows the effect of digestion, while the return toward baseline supports the claim that negative feedback occurred. A graph alone does not prove which hormone caused the change. Hormone measurements or a controlled comparison would provide stronger evidence about the mechanism.

When Feedback Fails
Homeostasis can be disrupted when a sensor, signal, control pathway, or effector does not work effectively. In type 1 diabetes, an autoimmune process destroys pancreatic beta cells, so the body produces little or no insulin. In type 2 diabetes, body cells become less responsive to insulin, and insulin production may also decline over time. In both cases, blood glucose can remain above the healthy range and damage tissues. Treatment may include glucose monitoring, medication, insulin, nutrition planning, and physical activity under medical guidance. Human and physical systems can also influence management. For example, neighborhood access to affordable food, health care, safe recreation areas, and transportation can affect a person’s options. In turn, community needs can influence where clinics, food markets, and public spaces are developed.

Explain the System
A strong explanation connects evidence to the parts of the feedback loop. Students can investigate glucose regulation safely by analyzing an anonymized or simulated data set rather than changing their own blood glucose. One group might compare glucose values before and after a standardized meal, while another compares the same time points without a meal. Keep measurement times and graph scales consistent. Calculate the change from baseline, identify the peak, and measure recovery time. If values rise after the meal and later move back toward baseline, that pattern supports the claim that a negative feedback mechanism maintains homeostasis. The explanation should identify rising glucose as the stimulus, pancreatic beta cells as sensors and signaling cells, insulin as the signal, and liver, muscle, and other body cells as effectors. It should also name limitations, such as individual variation or missing hormone measurements.
