Sustainable Resource Management: Evaluating Solutions with Evidence
Students analyze environmental and socioeconomic data to evaluate competing strategies for managing a shared natural resource sustainably.

Illustrations are auto-generated and may be placeholders. They can be refreshed to match the narration.
The Challenge of Shared Resources
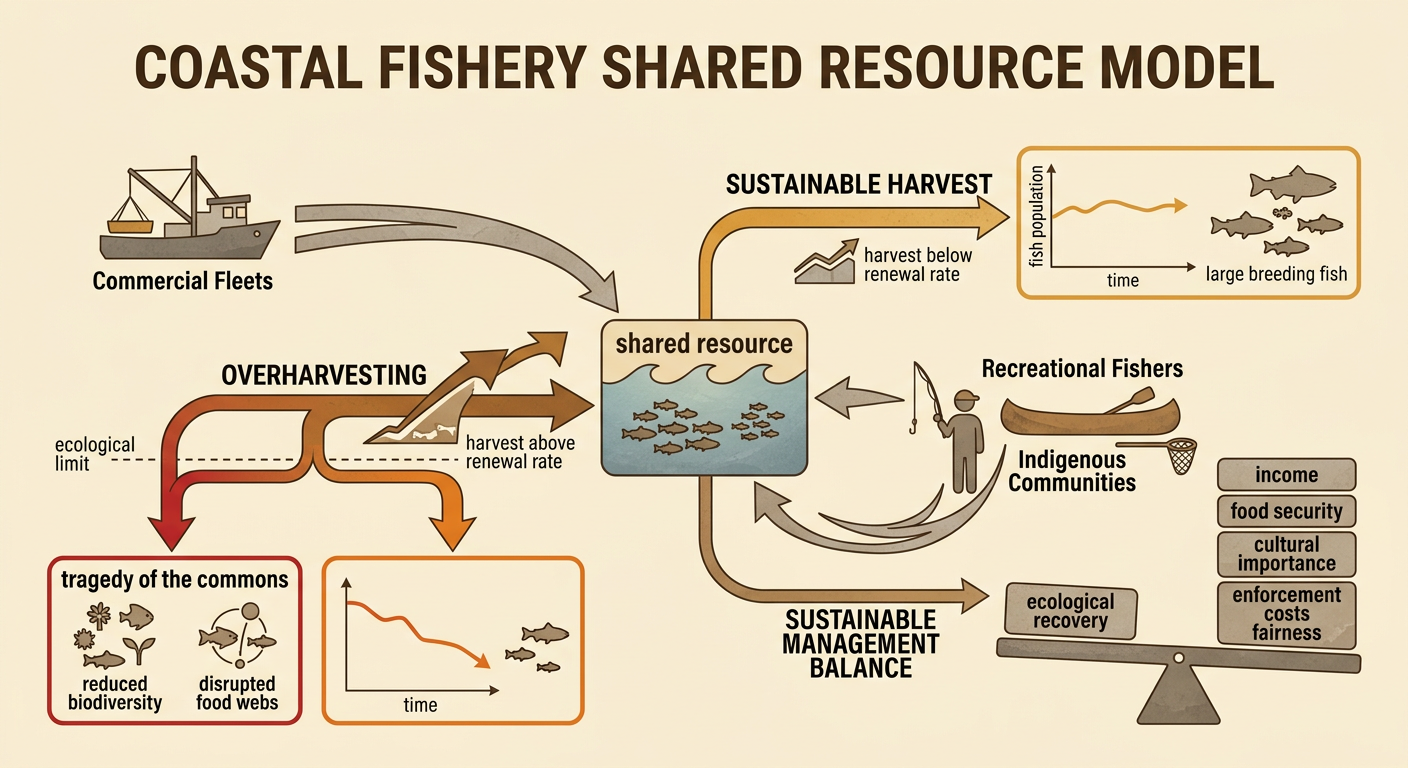
A shared natural resource can be used by many people, but no single user may have enough incentive or authority to protect it. If each user seeks the greatest short-term benefit, total use can exceed the resource’s ability to recover. This pattern is often called the tragedy of the commons. Consider a coastal fishery shared by commercial fleets, recreational fishers, and Indigenous communities. Catching more fish may increase income and food supplies today, but persistent overharvesting can reduce breeding populations, disrupt food webs, and threaten future livelihoods. Sustainable management aims to keep resource use within ecological limits while supporting human well-being. Effective decisions therefore consider the resource’s renewal rate, biodiversity, economic benefits, cultural importance, enforcement costs, and fairness. Political boundaries add difficulty because fish, rivers, wildlife, and air pollution can move across jurisdictions.
Interpreting Resource and Biodiversity Data
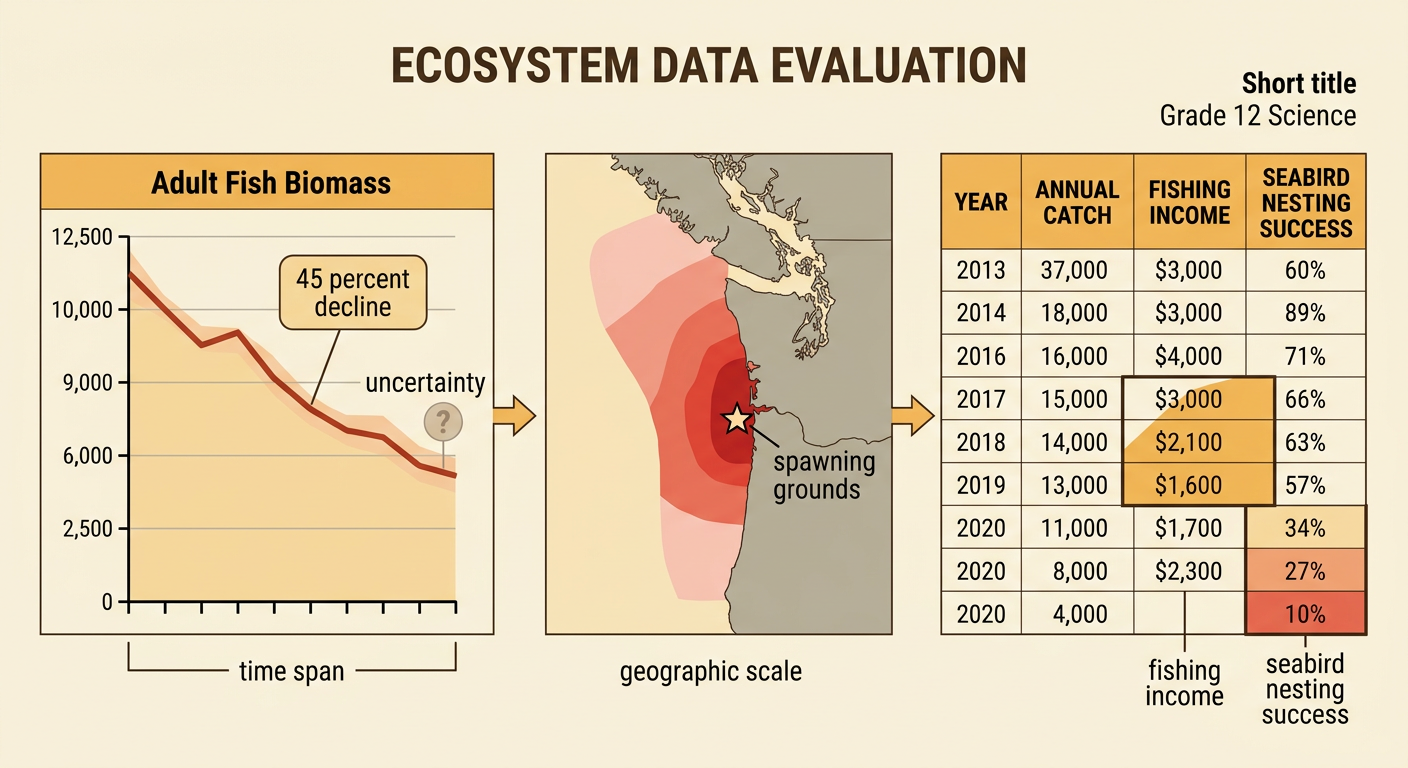
Evaluating management options requires integrating information from graphs, maps, tables, field surveys, and community reports. Begin by identifying each source’s variables, units, time span, geographic scale, and uncertainty. In a fishery study, a line graph might show that adult fish biomass declined by 45 percent over ten years, while a map shows the greatest losses near spawning grounds. A table may also report falling seabird nesting success because seabirds depend on the same fish for food. Economic records could show that fishing income initially rose as harvest increased, then fell as fish became scarce. These sources support a stronger conclusion together than any one source alone. However, correlation does not automatically prove causation. Students should consider other influences, such as ocean temperature, habitat damage, changing market prices, sampling methods, and whether the data represent the entire ecosystem.
Modeling Management Tradeoffs
A computational simulation represents how a resource system may change under different management rules. A simple fishery model can update the fish population each year by adding reproduction and subtracting natural deaths and human harvest. Students can run the model for 30 years under three strategies: unrestricted harvest, a fixed catch limit, and a catch limit that changes with fish abundance. Outputs might include fish population, number of species supported, total catch, jobs, and the risk of population collapse. Assumptions must be stated clearly, such as the reproduction rate, habitat capacity, market demand, and compliance with regulations. Repeated runs can vary uncertain inputs to test whether a strategy remains effective under different conditions. A model does not predict the future with certainty. Instead, it makes relationships visible and allows decision makers to compare likely consequences, feedback loops, and tradeoffs before adopting a policy.

Comparing Stakeholder Priorities
Resource policies affect groups differently because stakeholders have distinct needs, rights, knowledge, and levels of political influence. In a coastal fishery, commercial operators may prioritize stable income and predictable catch limits. Small-scale fishers may need local access and protection from large fleets. Indigenous communities may emphasize treaty rights, food security, and cultural relationships with particular species and places. Conservation organizations may focus on habitat protection and biodiversity, while local governments may consider employment, tax revenue, and enforcement costs. A useful comparison matrix scores each management option against shared criteria, such as population recovery, jobs, equity, cultural continuity, cost, and feasibility. Scores should be supported with evidence rather than personal preference. Students should also examine how past political and economic decisions, such as subsidies for larger boats or exclusion from traditional fishing areas, changed both the environment and the distribution of benefits. A fair process includes affected communities in decision making.

Defending an Evidence-Based Strategy
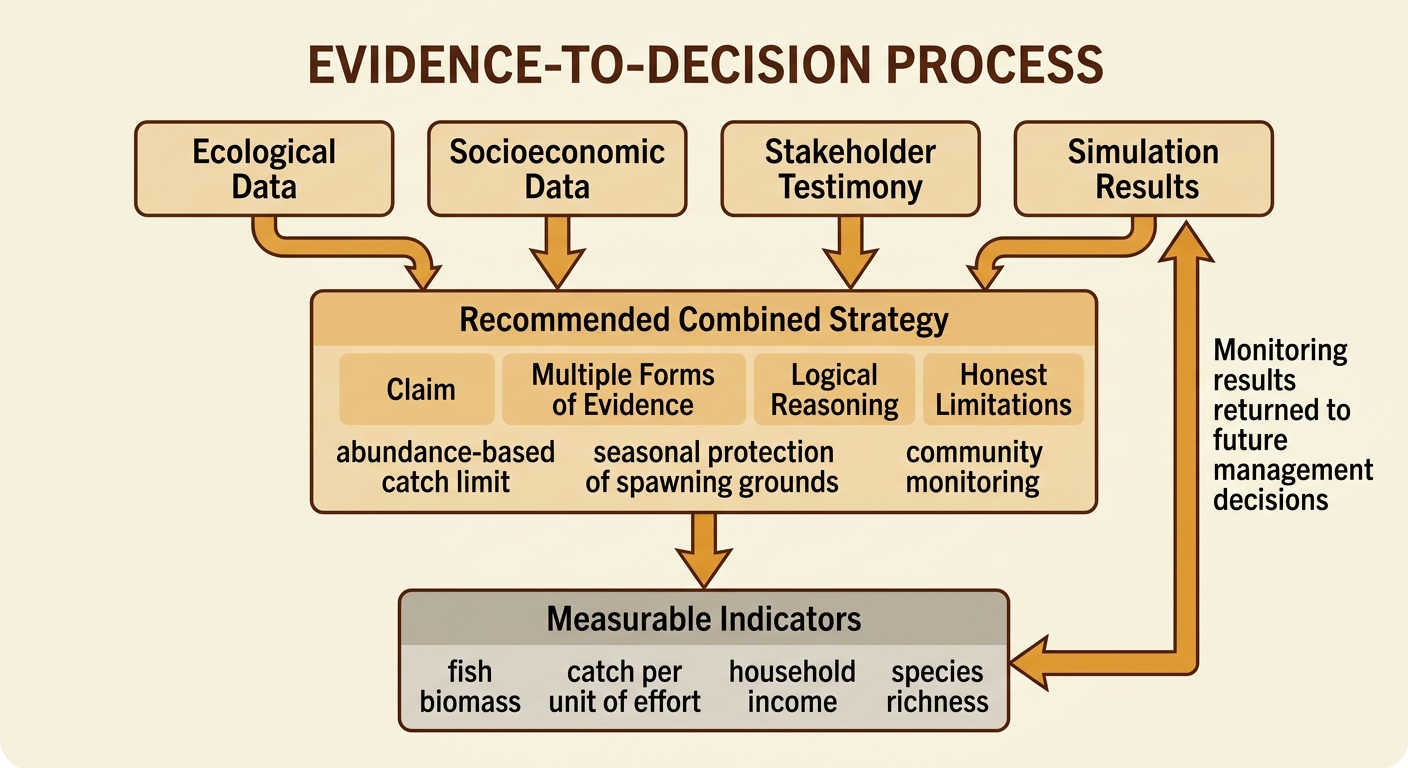
A defensible recommendation makes a clear claim, supports it with multiple forms of evidence, explains the reasoning, and addresses limitations. For example, students might recommend an abundance-based catch limit combined with seasonal protection of spawning grounds and community monitoring. Simulation results may show that this strategy maintains fish biomass above a collapse threshold in most runs while producing steadier long-term catches than unrestricted harvest. Biodiversity surveys may show improved seabird nesting near protected areas, and economic data may indicate that short-term income losses are followed by more stable employment. The argument should acknowledge uncertainty, enforcement costs, and unequal effects on fishers who cannot easily change locations or equipment. It should also compare the recommendation directly with alternatives. Measurable indicators, such as fish biomass, catch per unit of effort, household income, and species richness, allow managers to review outcomes and adjust the policy when evidence changes.