
Testing an Algorithm for Bias
Students analyze demographic outcome data from a simplified automated decision system, identify possible algorithmic bias, and recommend a fairer design.

Illustrations are auto-generated and may be placeholders. They can be refreshed to match the narration.
How Automated Decisions Work
An automated decision system follows rules or a trained model to turn input data into an output. Imagine a summer technology program that uses an algorithm to recommend which applicants should receive interviews. Inputs might include course grades, attendance, experience, and ZIP code. The system assigns each applicant a score, then recommends applicants above a cutoff. People still choose the inputs, training data, cutoff, and meaning of success. Therefore, an algorithm is not automatically neutral. For example, if the system rewards prior coding experience, applicants from schools without coding courses may receive lower scores even when they have strong potential. Testing for bias means examining both how the system works and whether its outcomes differ across demographic groups in ways that may be unfair.

Review the Outcome Data
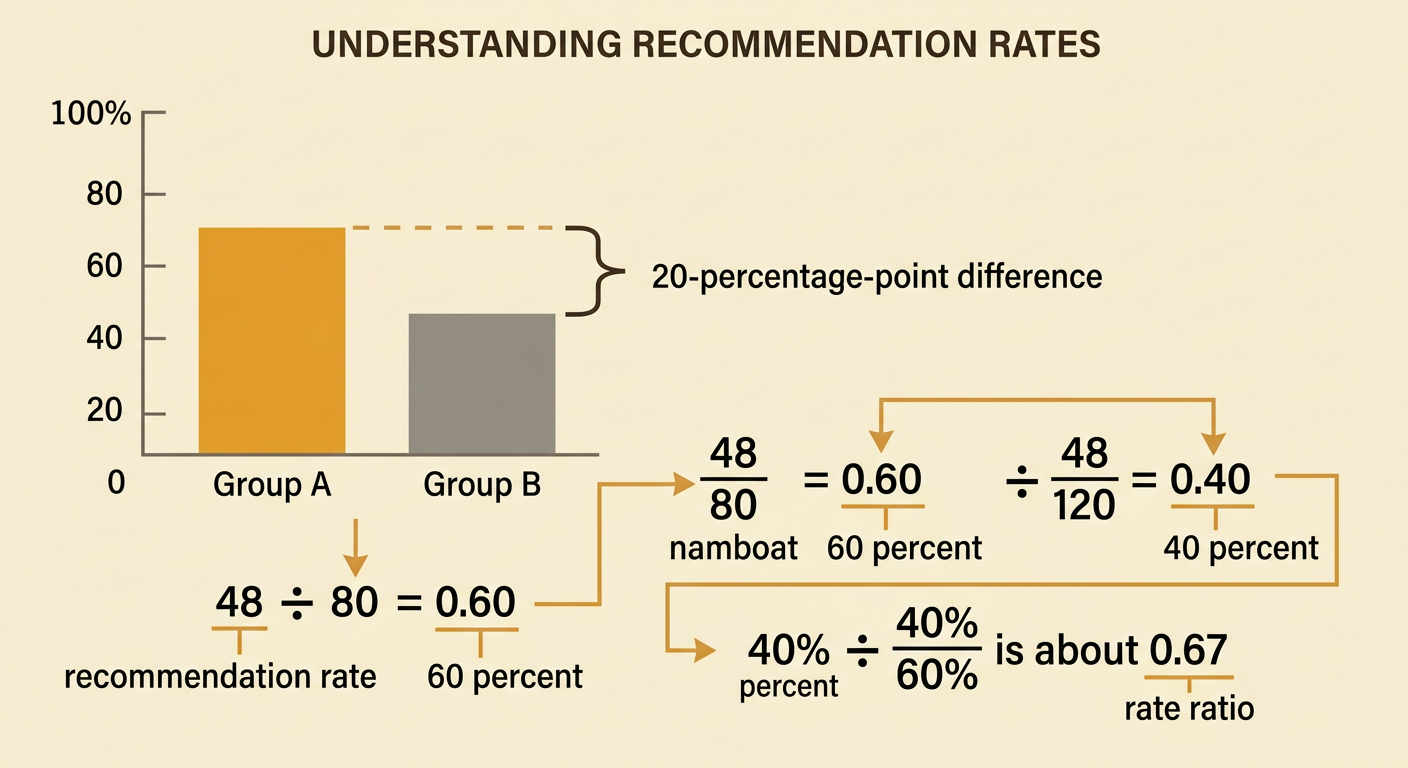
Consider results from a fictional group of 200 applicants. Group A had 80 applicants: 48 were recommended for interviews and 32 were not. Group B had 120 applicants: 48 were recommended and 72 were not. This is a two-way frequency table because it organizes counts by two categorical variables: demographic group and outcome. First, check the totals. The group totals are 80 and 120, while the outcome totals are 96 recommended and 104 not recommended. Together they equal 200 applicants. The equal count of 48 recommendations in each group might initially appear fair. However, the groups had different numbers of applicants, so counts alone do not show each applicant’s chance of receiving a recommendation. Relative frequencies are needed for a meaningful comparison.

Calculate and Compare Group Rates
To compare outcomes fairly, calculate the recommendation rate within each group. Divide the number recommended by the total number in that group. For Group A, 48 divided by 80 equals 0.60, or 60 percent. For Group B, 48 divided by 120 equals 0.40, or 40 percent. The difference is 20 percentage points. Another comparison is the rate ratio: 40 percent divided by 60 percent is about 0.67, meaning Group B’s rate is about two-thirds of Group A’s rate. This disparity is evidence that the outcomes differ, but it does not by itself prove intentional discrimination or identify the cause. Investigators should examine relevant qualifications, data quality, model rules, and repeated results before deciding whether the difference reflects bias.
Identify Possible Sources of Bias
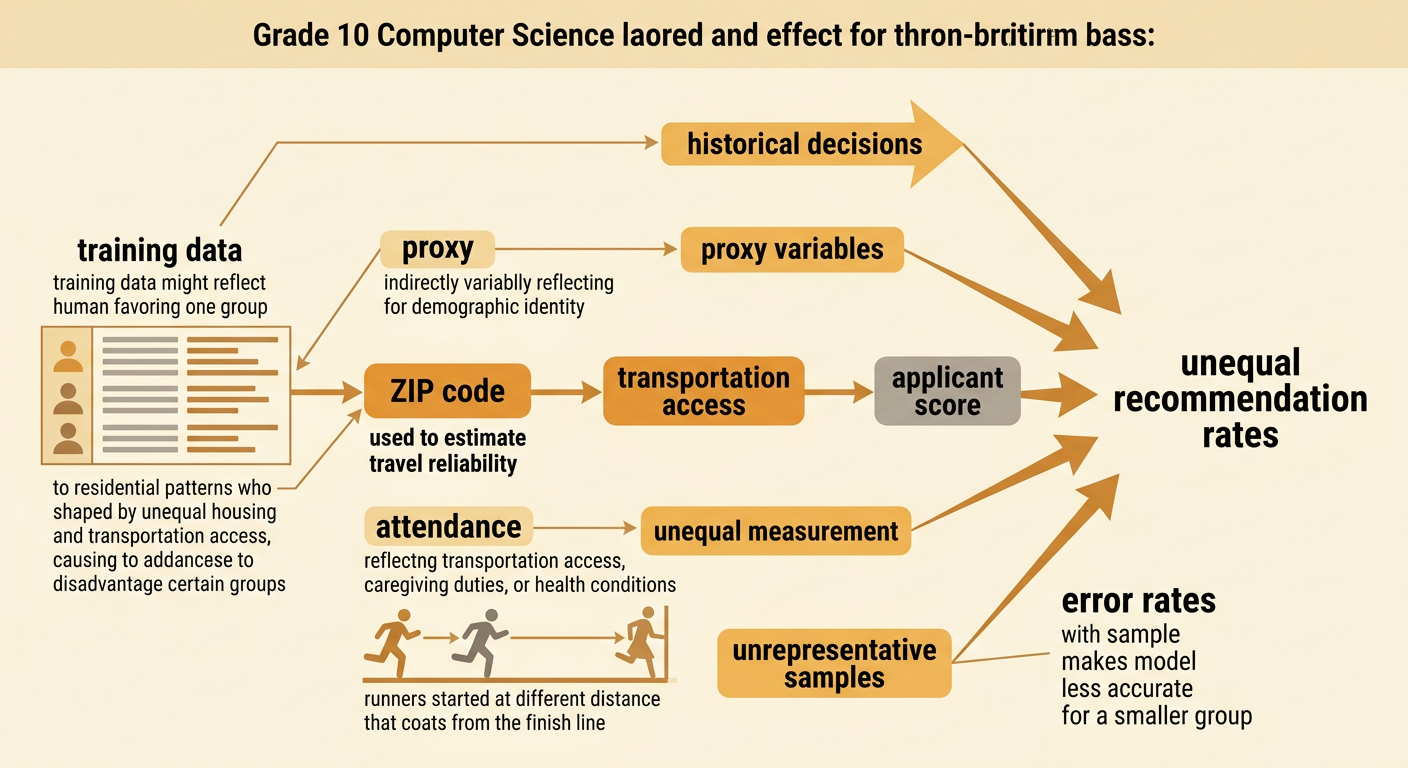
A group-rate gap can arise at several stages of an automated system. Historical training data may contain earlier human decisions that favored one group. A variable may also act as a proxy for demographic identity. For example, ZIP code might appear useful for estimating travel reliability, but residential patterns shaped by unequal access to housing and transportation could make it disadvantage applicants from Group B. Measurement can introduce bias too. Attendance records may reflect unequal access to reliable transportation rather than effort. A sample that contains too few applicants from one group may produce an inaccurate model for that group. Investigators should test competing explanations rather than assuming one cause. They can compare error rates, remove one variable at a time, review data sources, and ask affected communities whether the criteria measure genuine program readiness.
Redesign for Fairness
A fairer design should be evaluated using prioritized criteria, not just overall accuracy. The team could prioritize equal access to consideration, valid measurement of program readiness, privacy, transparency, and manageable cost. In this example, it could remove ZIP code, replace prior coding experience with a short skills task available to every applicant, and use the same scoring guide for all responses. The team should then test whether the redesign predicts program success and reduces group-rate and error-rate gaps. Removing ZIP code may improve fairness and privacy, but it could eliminate information related to transportation needs. A better response may be to assess skills without ZIP code and separately offer transportation support. Human review and an appeal process can address unusual cases, although they require time and can reintroduce human bias. Regular audits should check whether improvements continue.

Exit Reflection
Write a claim about whether the evidence supports concern about possible algorithmic bias. Use at least two pieces of evidence, such as the 60 percent recommendation rate for Group A, the 40 percent rate for Group B, or the possible effect of ZIP code. Then explain your reasoning and name information still needed, such as applicant qualifications or error rates. Your conclusion should distinguish a warning sign from proof of a cause. Also consider civic perspectives. Applicants may value equal treatment, privacy, explanation, and a chance to appeal. Program leaders may value accuracy, efficiency, and limited cost. A democratic design should respect rights and include the perspectives of people affected by the system. End by recommending one change and identifying one trade-off that decision-makers should monitor.
