
Testing Ideas with a Fair Investigation
Students develop a testable question, identify variables, collect and organize measurements, and use evidence to decide whether the results support their prediction.
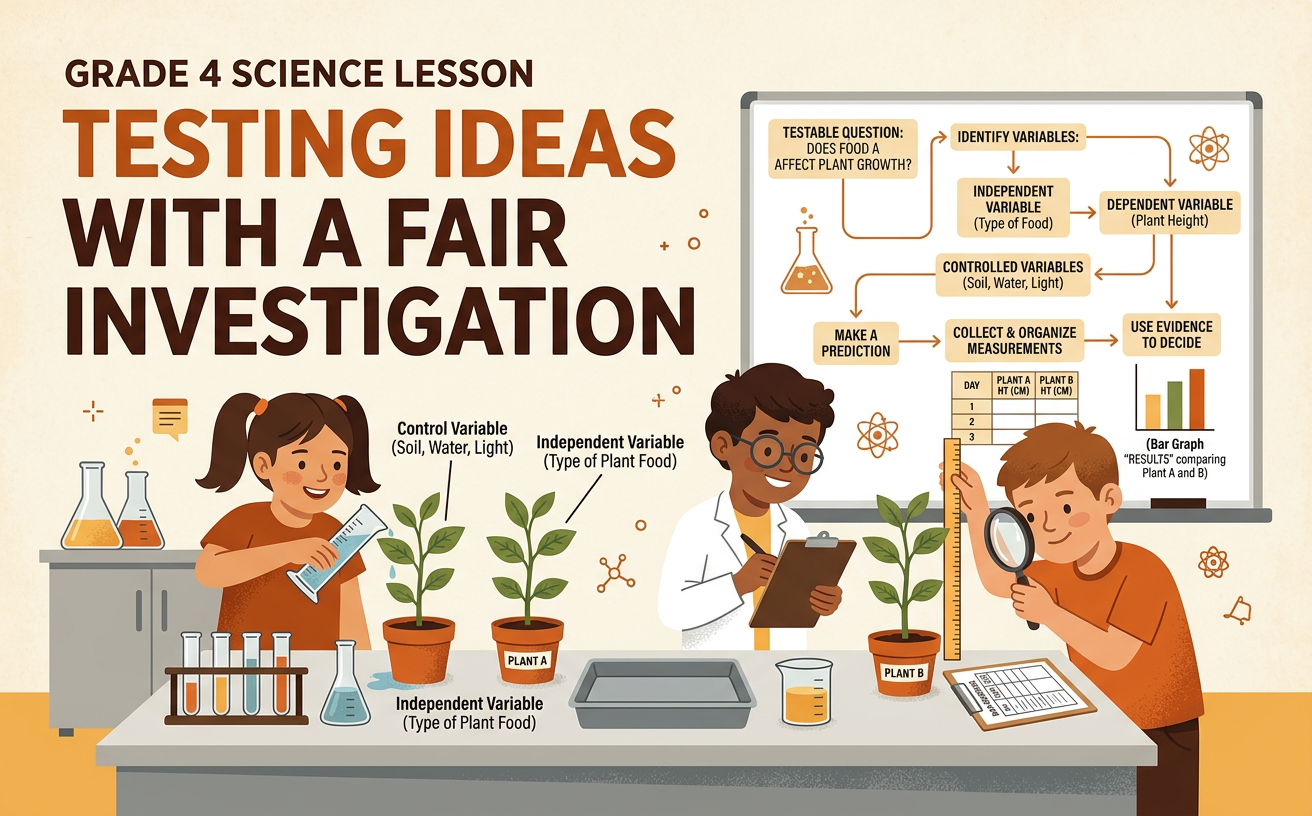
Illustrations are auto-generated and may be placeholders. They can be refreshed to match the narration.
Ask a Testable Question
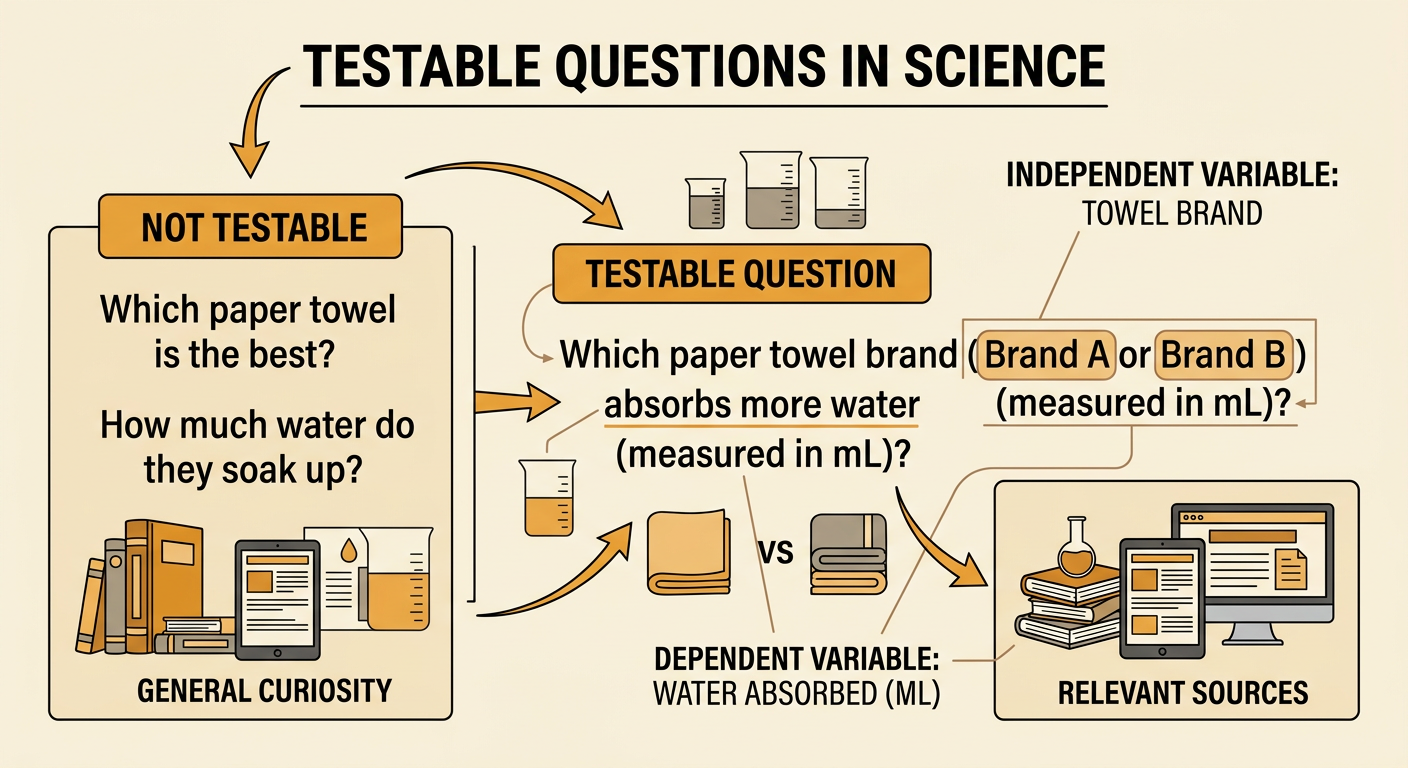
A fair investigation begins with a question that can be answered by changing one factor and measuring a result. “Which paper towel is best?” is too broad because “best” could mean strongest, softest, or most absorbent. A testable version is, “How does paper towel brand affect the amount of water a 15-centimeter square absorbs in 10 seconds?” The changed factor is the paper towel brand. The measured outcome is the volume of water absorbed in milliliters. Before testing, find relevant background information in a science book, a reliable website, or product information. These sources can explain absorption and help you choose safe methods. Record each source and the useful facts it provides. A strong testable question names what will change, what will be measured, and any important conditions.
Make a Prediction
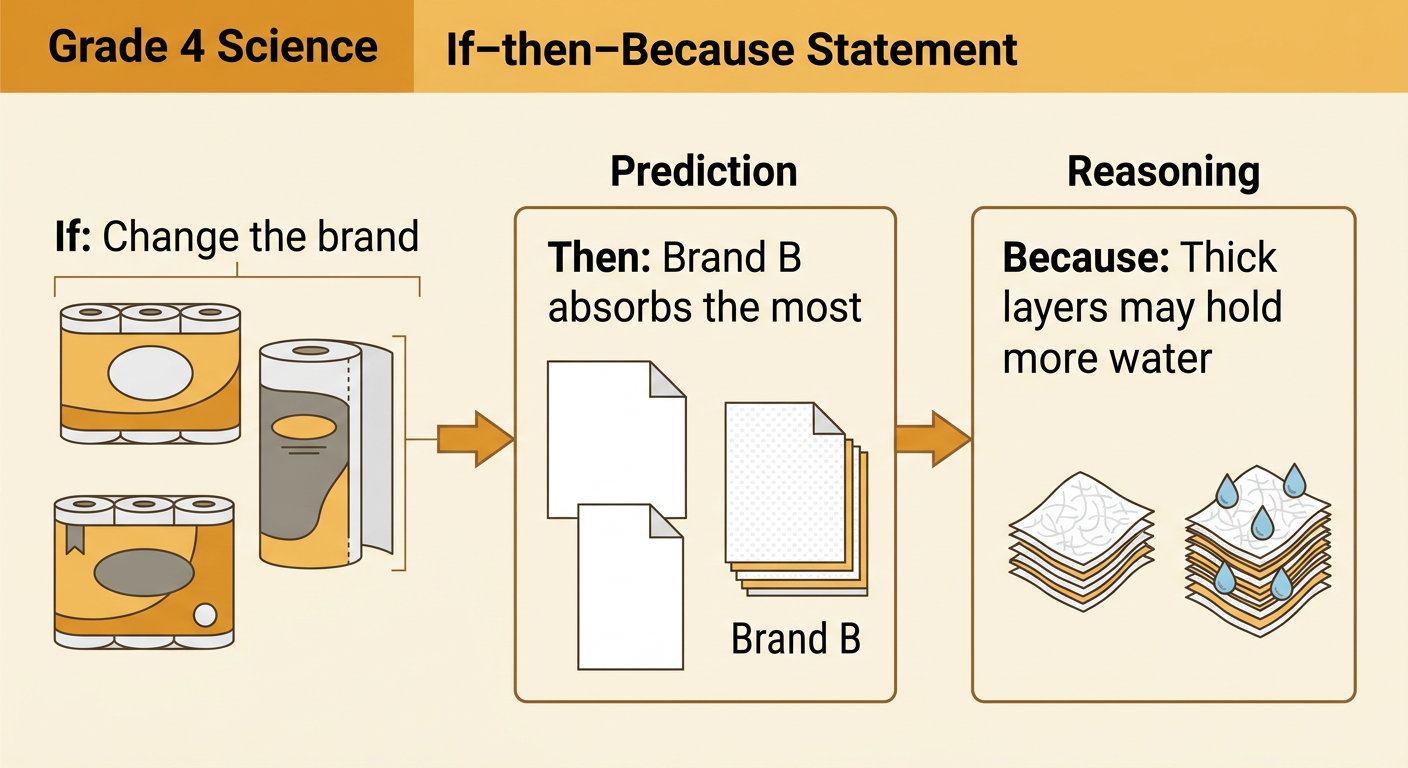
A prediction states what you think will happen before the investigation begins. It should answer the testable question and include a reason. For example, “If equal-sized pieces of Brands A, B, and C are tested, then Brand B will absorb the most water because its thick, textured layers may hold more water.” This is an if-then-because prediction. The “if” part names the change, the “then” part tells the expected result, and the “because” part gives the reasoning. Background information from a source can strengthen the reasoning, but a package claim is not proof. The investigation will provide the evidence. Record the prediction before collecting data so that it is not changed to match the results. A prediction does not have to be correct; it must be reasonable and testable.
Plan a Fair Test
In a fair test, only the independent variable changes. For the paper towel investigation, change only the brand. Keep the controlled variables the same: cut every sample to 15 centimeters by 15 centimeters, begin with 50 milliliters of water, soak each sample for 10 seconds, and use the same tray and measuring tools. Test one dry sample at a time. After 10 seconds, lift it in the same way, allow it to drip for 5 seconds, and measure the water left. Subtract the volume left from 50 milliliters to find the volume absorbed. Dry the tray before the next test. Complete at least three trials for each brand using new samples. Repeated trials make the evidence more dependable and can reveal unusual results. Write the numbered procedure before starting so another group could repeat it exactly.

Measure and Record Data
Careful measurements turn observations into useful evidence. Begin each trial with exactly 50 milliliters of water. When reading a graduated cylinder, place it on a level surface and look straight across at the bottom of the curved water surface, called the meniscus. Record the amount of water left after the towel test. Then calculate the absorbed volume. If 31 milliliters remain, the towel absorbed 19 milliliters because 50 minus 31 equals 19. Enter the result immediately in a data table with the brand, trial number, starting volume, volume left, and volume absorbed. Use the same unit, milliliters, in every row. Sample results might be Brand A: 18, 20, and 19 milliliters; Brand B: 25, 24, and 26 milliliters; and Brand C: 20, 21, and 19 milliliters. Do not replace unexpected measurements.
Analyze the Evidence
To analyze evidence, look for patterns, differences, and unusual results. Organize the measurements in a table or graph so the brands can be compared. In the sample data, Brand A absorbed 18 to 20 milliliters, Brand B absorbed 24 to 26 milliliters, and Brand C absorbed 19 to 21 milliliters. Brand B had the greatest measurement in all three trials, so the repeated evidence shows a clear pattern. The smallest Brand B result, 24 milliliters, is still 3 milliliters greater than the largest Brand C result, 21 milliliters. A bar graph should have an even number scale, labeled axes, units, and separate bars for each trial. Check whether any measurement is far from the others. An unusual value may result from a measuring mistake, but it should not be removed without a scientific reason. Evidence, not preference, should guide the decision.
Draw and Share a Conclusion
A conclusion answers the testable question using evidence from the investigation. Begin by stating whether the results support the prediction. For example, “The results support my prediction that Brand B would absorb the most water.” Next, include specific measurements: Brand B absorbed 24 to 26 milliliters, while Brand A absorbed 18 to 20 milliliters and Brand C absorbed 19 to 21 milliliters. Explain the reasoning: because Brand B had the highest result in every trial, the evidence indicates that brand affected water absorption under these test conditions. Do not claim that Brand B is always best because the test measured only absorption with one sample size and one soaking time. Share the question, sources, procedure, data display, and conclusion in a short report or presentation. Suggest a next investigation, such as testing towel strength when wet, and invite questions about the method.