
The Black Death: Disease, Trade, and Social Change in Medieval Eurasia
Students use maps, population data, and historical accounts to explain how trade networks helped spread the Black Death and how the pandemic transformed medieval economies and societies.
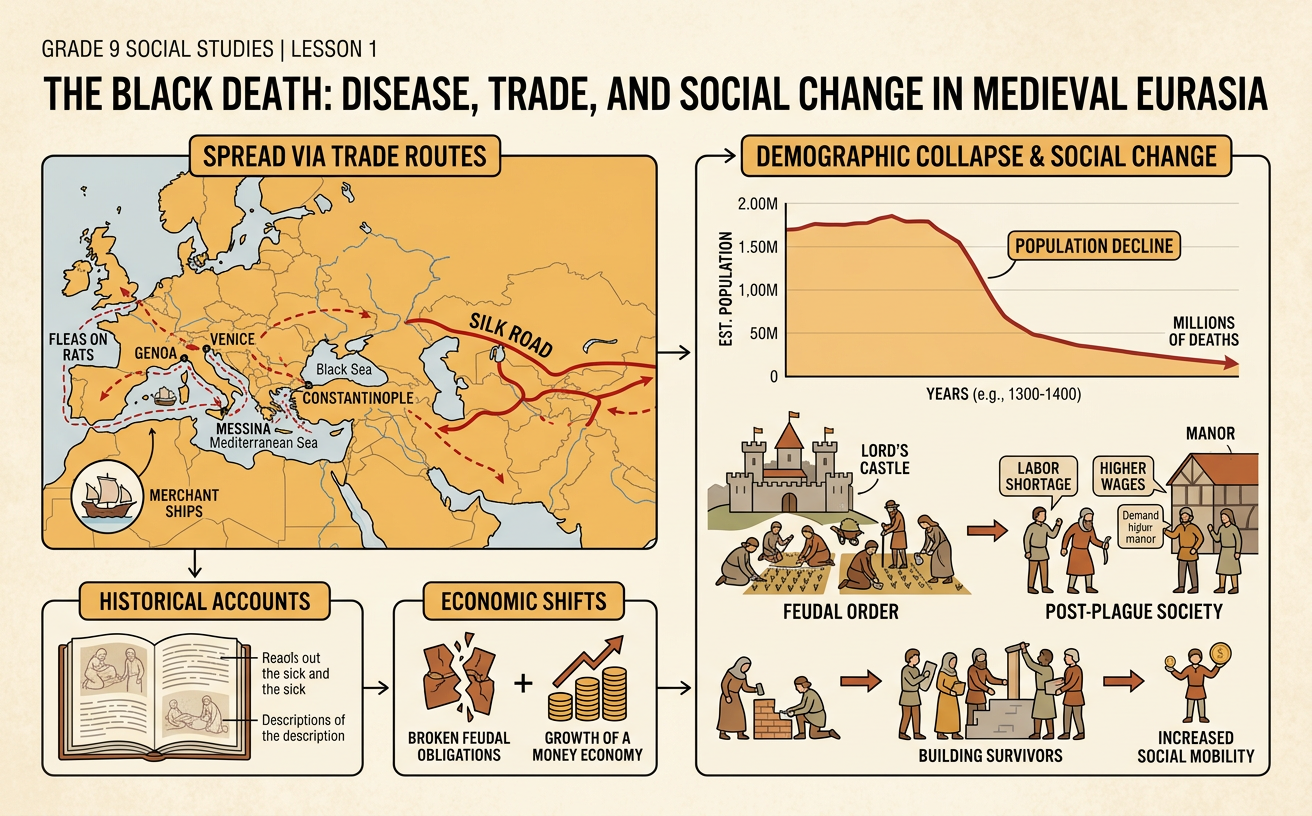
Illustrations are auto-generated and may be placeholders. They can be refreshed to match the narration.
Eurasia Before the Plague
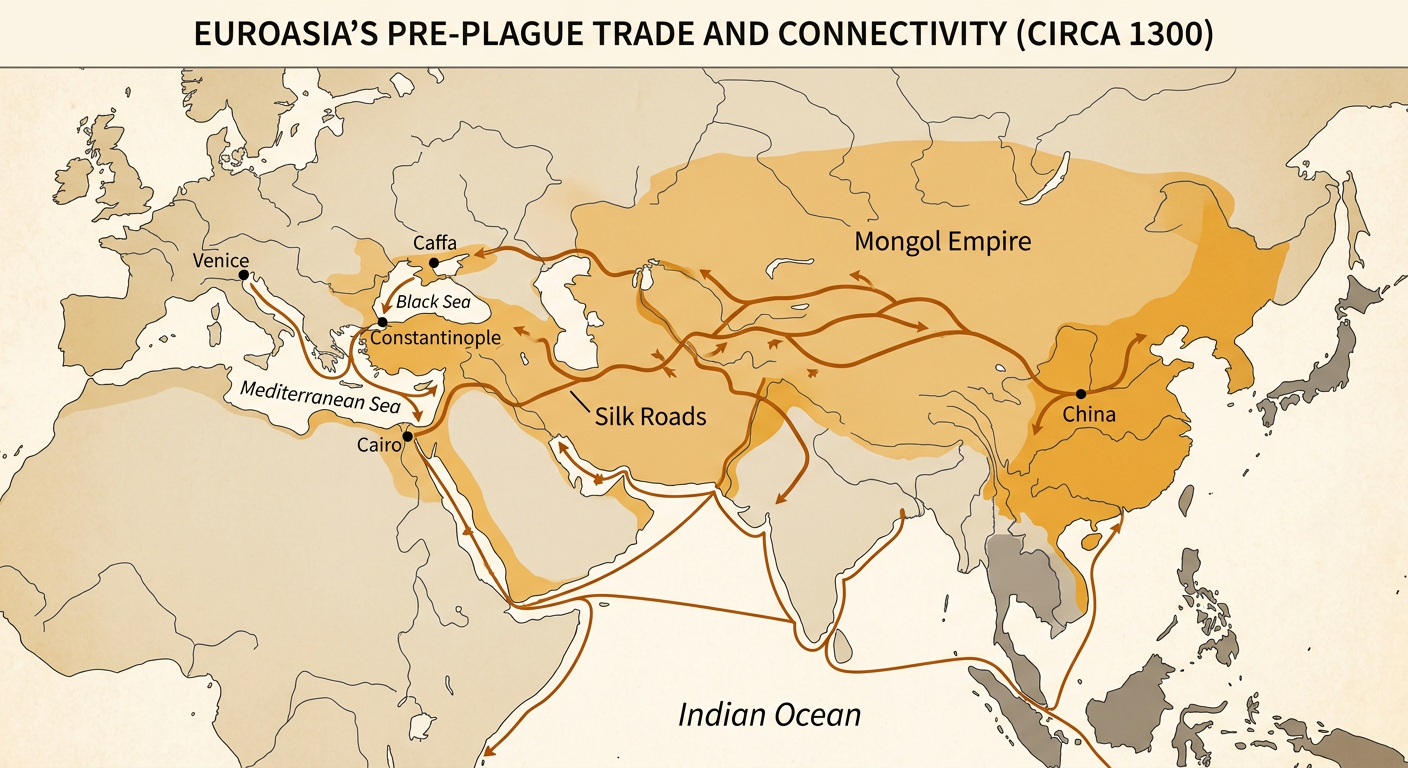
Before the Black Death, Eurasia was connected by expanding trade, growing cities, and powerful states. Land routes often called the Silk Roads linked East Asia, Central Asia, the Middle East, and Europe. Maritime routes crossed the Indian Ocean and Mediterranean Sea. Merchants carried silk, spices, metals, grain, and other goods, while travelers exchanged technologies, beliefs, and news. The Mongol Empire made some long-distance travel easier by controlling a large part of Eurasia, although conflict and danger continued. Dense cities and busy ports placed people, animals, and stored goods close together. These conditions helped diseases move between regions. For example, the Black Sea port of Caffa connected inland caravan routes with ships traveling to Mediterranean ports, making it an important link in both commerce and disease transmission.
Trade Routes and Disease Transmission
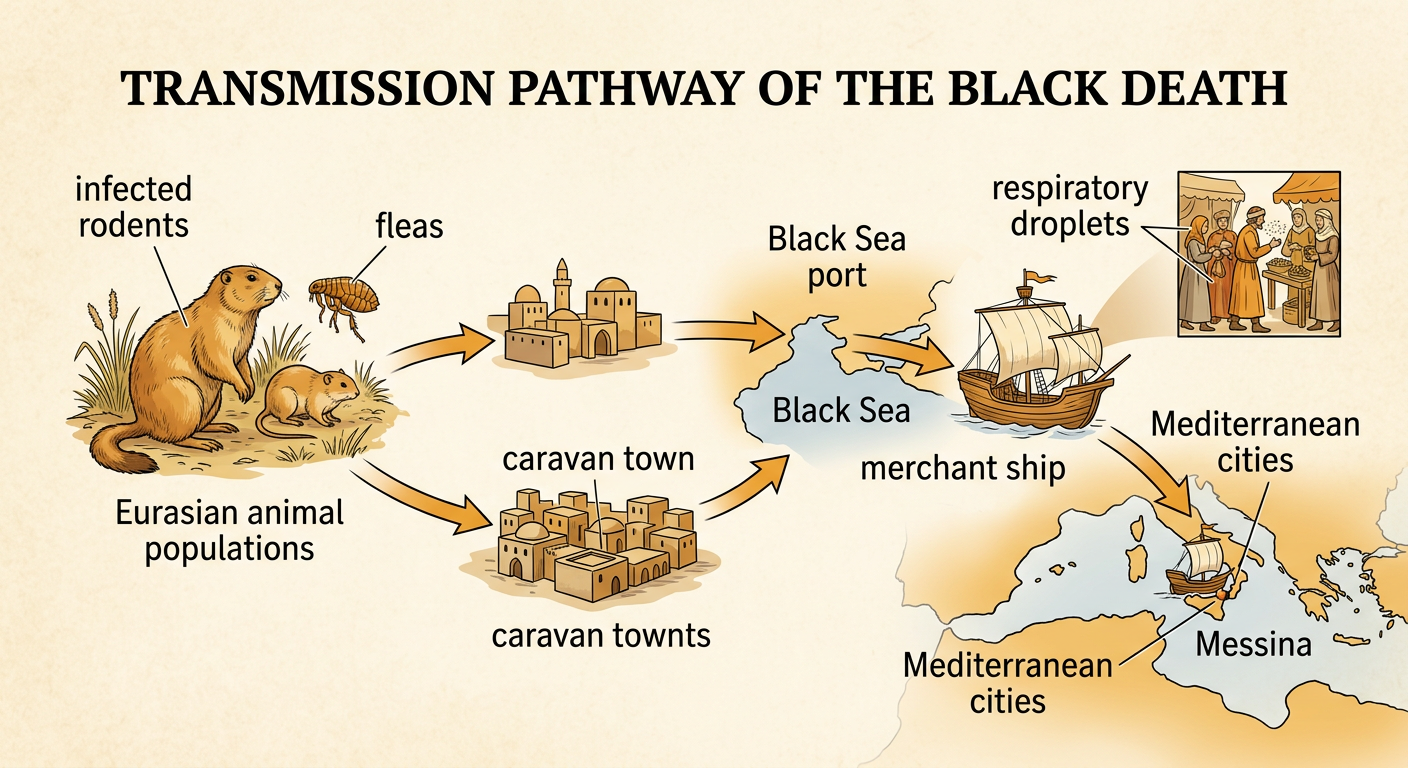
The Black Death was caused by the bacterium Yersinia pestis. Genetic and historical evidence connects the pandemic to plague circulating in Eurasian animal populations before it reached the Black Sea region and Europe in the late 1340s. Fleas associated with infected rodents likely contributed to transmission, while direct human contact and respiratory droplets could spread some forms of plague. Trade accelerated movement between communities. Caravans stopped at crowded market towns, and ships carried people, food, animals, fleas, and rats between ports. In 1347, ships traveling from the Black Sea brought plague to Mediterranean ports, including Messina in Sicily. From there, the disease spread along sea lanes and roads. Trade did not create the bacterium, but connected transportation networks helped local outbreaks become a pandemic across much of Eurasia and North Africa.
Reading Maps and Population Data
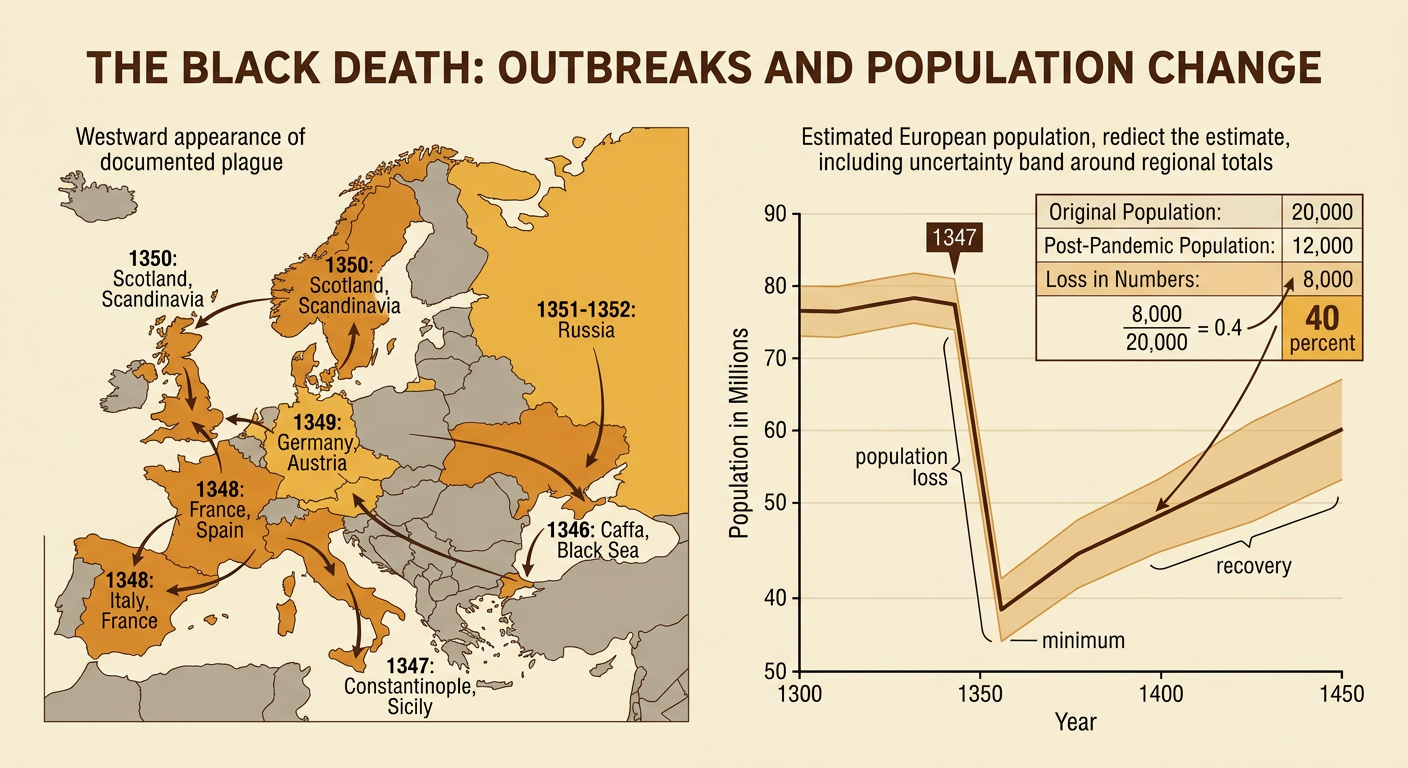
Maps show where plague outbreaks appeared, while graphs and tables help measure population change over time. Students should compare dates, locations, scale, and source uncertainty rather than treating every number as exact. Estimates suggest that Europe's population fell from roughly 75–80 million before the pandemic to about 50–55 million by around 1400, although historians disagree about totals and regional patterns. On a line graph, the sharp downward segment after 1347 represents rapid population loss, not a steady decline across every place. The lowest point is a minimum, and a later upward trend shows recovery. A city-level table may reveal greater losses in one port than in a nearby rural area. For example, if a town declined from 20,000 residents to 12,000, the decrease was 8,000 people, or 40 percent. Quantitative evidence becomes meaningful when connected to historical context.
Economic and Social Consequences
The Black Death changed medieval economies because widespread mortality reduced both the number of workers and the number of consumers. In many regions, surviving laborers could demand higher wages or better terms because landowners competed for scarce workers. Some peasants moved to towns, left estates, or challenged labor obligations. Governments and elites sometimes tried to limit wages and mobility, as England did with the Statute of Laborers in 1351. These efforts contributed to tension but did not produce identical results everywhere. Land values and rents often fell, some farms shifted from grain production to less labor-intensive livestock raising, and property passed to surviving relatives. Religious practices, family structures, and attitudes toward authority also changed. For example, a manor that had employed 30 harvest workers might find only 18 available, forcing its owner to raise pay, reduce production, or change land use.

Evaluating Historical Explanations
A strong historical explanation combines different kinds of evidence and recognizes multiple causes. Trade-route maps can show connections, population graphs can show the scale and timing of loss, and written accounts can reveal how people experienced events. Each source also has limits. Medieval chroniclers sometimes used rumors, moral judgments, or exaggerated numbers, while modern population estimates rely on incomplete tax, burial, and land records. Students should ask who created a source, when it was created, what evidence it uses, and what it cannot prove. For example, a map showing plague in two ports connected by shipping supports the claim that maritime trade aided transmission, but it does not prove that one specific ship caused every infection. The best explanation connects disease biology, trade, urban crowding, war, climate conditions, and human responses without claiming that a single factor explains the entire pandemic.
