
The Case of the Mystery Trait: DNA, Probability, and Privacy
Students solve a fictional inheritance mystery by connecting DNA, chromosomes, alleles, and traits, using a Punnett square to predict outcomes, and considering the privacy of genetic information.
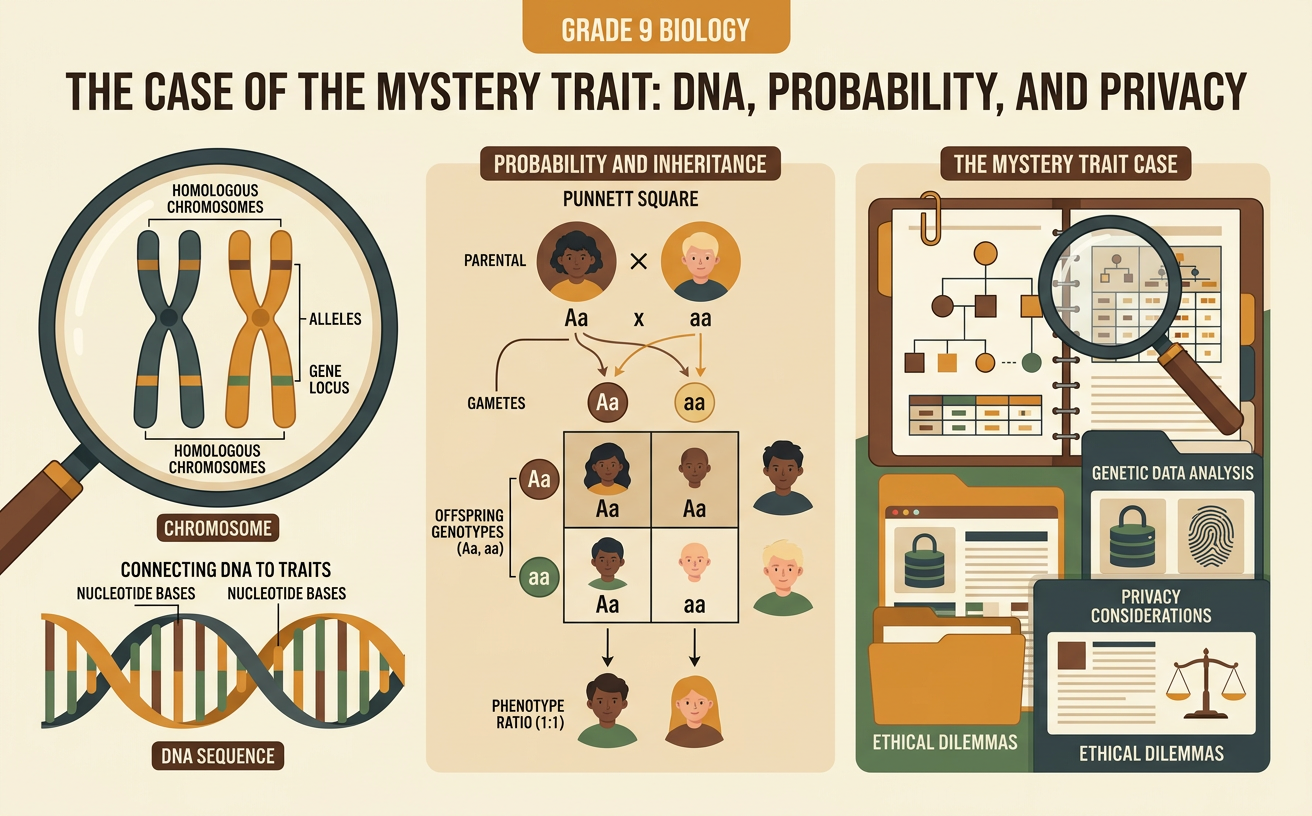
Illustrations are auto-generated and may be placeholders. They can be refreshed to match the narration.
Hook: Crack the Trait Mystery
A tray of fictional moonvine seedlings contains a surprise: some plants have silver-edged leaves, while others have plain green leaves. Both parent plants looked silver-edged. How could they produce a plain green offspring? Your job is to solve the mystery using evidence rather than guessing. Assume that one gene controls this classroom trait and that the gene has two versions, or alleles. The dominant allele S produces silver-edged leaves, while the recessive allele s produces plain green leaves. Each plant receives one allele from each parent. As you investigate, ask: What allele combinations could the parents have? Which combination produces the plain trait? This simplified fictional case will help you model inheritance, although most real traits are influenced by multiple genes, environmental conditions, or both.
DNA, Chromosomes, and Alleles
DNA is a molecule that stores biological instructions in sequences of chemical bases. Long DNA molecules are packaged with proteins into chromosomes. A gene is a segment of DNA associated with a product or function, and different versions of a gene are called alleles. In the moonvine example, the leaf-edge gene has allele S and allele s. A moonvine inherits one chromosome of a homologous pair from each parent, so it receives two alleles for this gene. The alleles occupy the same gene location, or locus, on the matching chromosomes. Before reproductive cells form, DNA is copied. During meiosis, the homologous chromosomes separate, so each egg or pollen cell receives only one allele. Fertilization joins two reproductive cells and restores the pair of alleles in the offspring.
Build a Genotype-to-Phenotype Model
A genotype is an organism’s allele combination, while a phenotype is an observable characteristic produced through interactions among genes and the environment. In this simplified model, S is completely dominant to s. Therefore, genotypes SS and Ss produce silver-edged leaves, but genotype ss produces plain green leaves. SS is homozygous dominant because its alleles match and are dominant. Ss is heterozygous because its alleles differ. ss is homozygous recessive. The dominant allele does not erase or change the recessive allele; it only determines the modeled phenotype when both are present. Thus, a silver-edged plant could be SS or Ss, but a plain green plant must be ss. Because the mystery parents produced an ss offspring, each parent had to contribute s. Their silver phenotype indicates that both parents were most likely Ss under this model.
Punnett Square Prediction Challenge
Test the hypothesis that both silver-edged parents have genotype Ss. During meiosis, each parent can produce reproductive cells carrying S or s. Place one parent’s possible alleles across the top of a two-by-two Punnett square and the other parent’s alleles along the side. Combine the row and column alleles in each box. The four equally likely boxes are SS, Ss, Ss, and ss. This predicts a 1:2:1 genotype ratio: 25% SS, 50% Ss, and 25% ss. The phenotype prediction is 75% silver-edged and 25% plain green. These percentages describe the probability for each individual offspring, not a guaranteed result for every group of four. A family of four seedlings could have no plain plants, one plain plant, or several plain plants simply because fertilization is random.
Compare Probability with Class Results
Now compare the mathematical model with experimental class data. Each student can simulate 20 offspring by flipping two coins: heads represents S, and tails represents s. Record each pair as SS, Ss, or ss, then combine the class totals. Suppose the class simulates 200 offspring and obtains 47 SS, 106 Ss, and 47 ss. The observed genotype percentages are 23.5%, 53%, and 23.5%, which are close to the predicted 25%, 50%, and 25%. Small differences are expected because random samples vary. A bar graph can display predicted percentages beside observed percentages for each genotype. As the number of trials increases, results often move closer to the predicted distribution, although exact agreement is not required. The simulation is a mathematical model; real inheritance can also be affected by biological processes not represented by coin flips.
Genetic Privacy Exit Question
Genetic information can reveal details about biological relationships, ancestry, or possible health risks, so collecting it creates questions about rights and responsibilities. Imagine that a school science club wants students to submit real DNA samples for an inheritance project. Before agreeing, students should ask who will access the data, how it will be stored, whether it will be deleted, and whether participation is truly voluntary. Informed consent means that a person understands the purpose, risks, benefits, and choices before deciding. Privacy means controlling access to personal information. Different people may view the project differently: a researcher may value useful data, a student may worry about disclosure, and a family may object to unexpected information. Exit question: Should the school collect real student DNA for this activity? State your claim, use evidence about benefits and risks, and propose one policy that protects individual rights.