The Dust Bowl: Environment, Migration, and Government Response
Students analyze maps, photographs, firsthand accounts, and environmental data to explain how agricultural practices, drought, and federal policies shaped Dust Bowl migration during the Great Depression.

Illustrations are auto-generated and may be placeholders. They can be refreshed to match the narration.
Great Plains Before the Dust Bowl
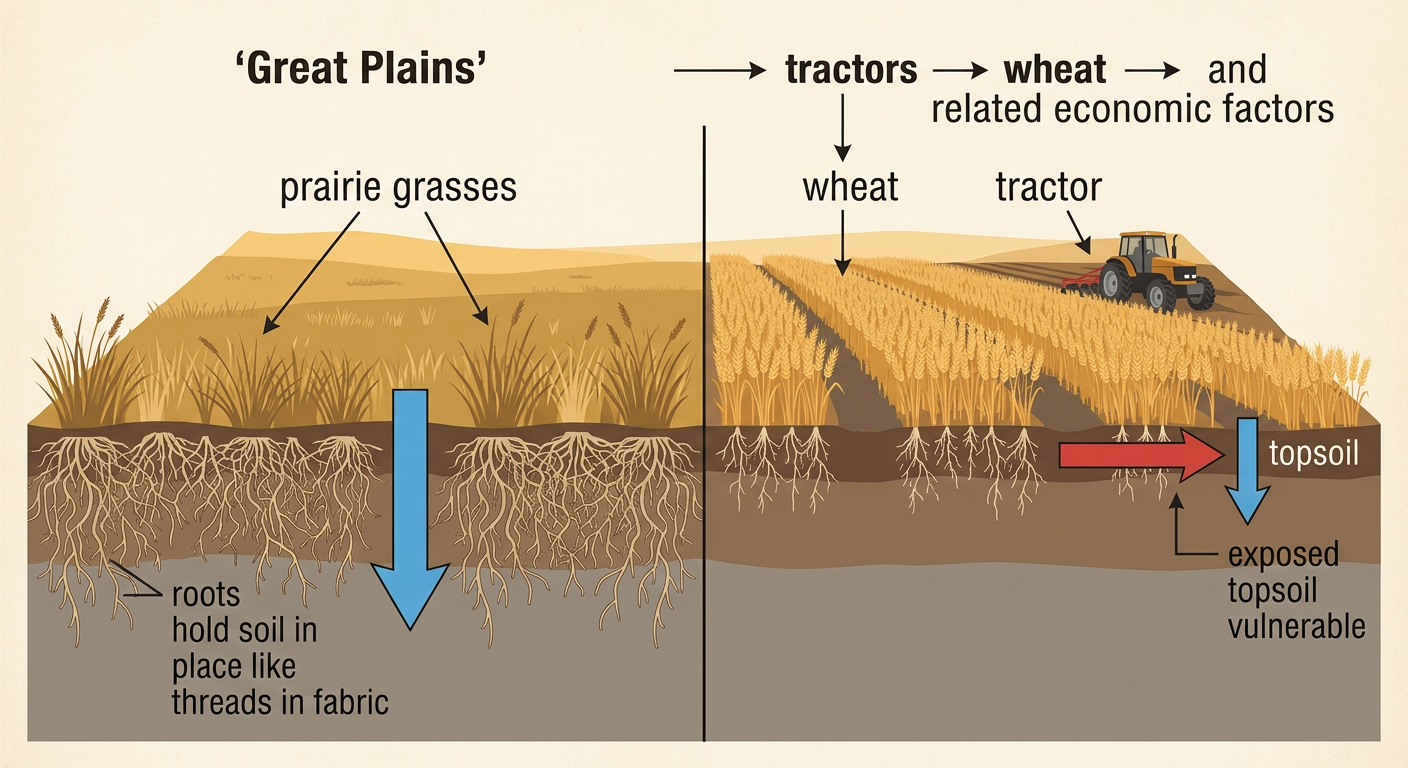
Before the 1930s, much of the Great Plains was grassland adapted to limited rainfall, strong winds, and periodic drought. Deep-rooted prairie grasses held soil in place and helped it absorb water. During the late 1800s and early 1900s, federal land policies, railroads, new machinery, and high wheat prices encouraged settlement and cultivation. Demand for wheat during World War I led farmers to plow millions of additional acres. Tractors made it possible to cultivate land faster and on a larger scale than before. For example, a farmer could replace native grass with a single wheat crop across an entire field. This increased production during wet years, but it removed the vegetation that protected dry topsoil. The region’s economic opportunity therefore developed alongside growing environmental risk.
Drought and Unsustainable Farming
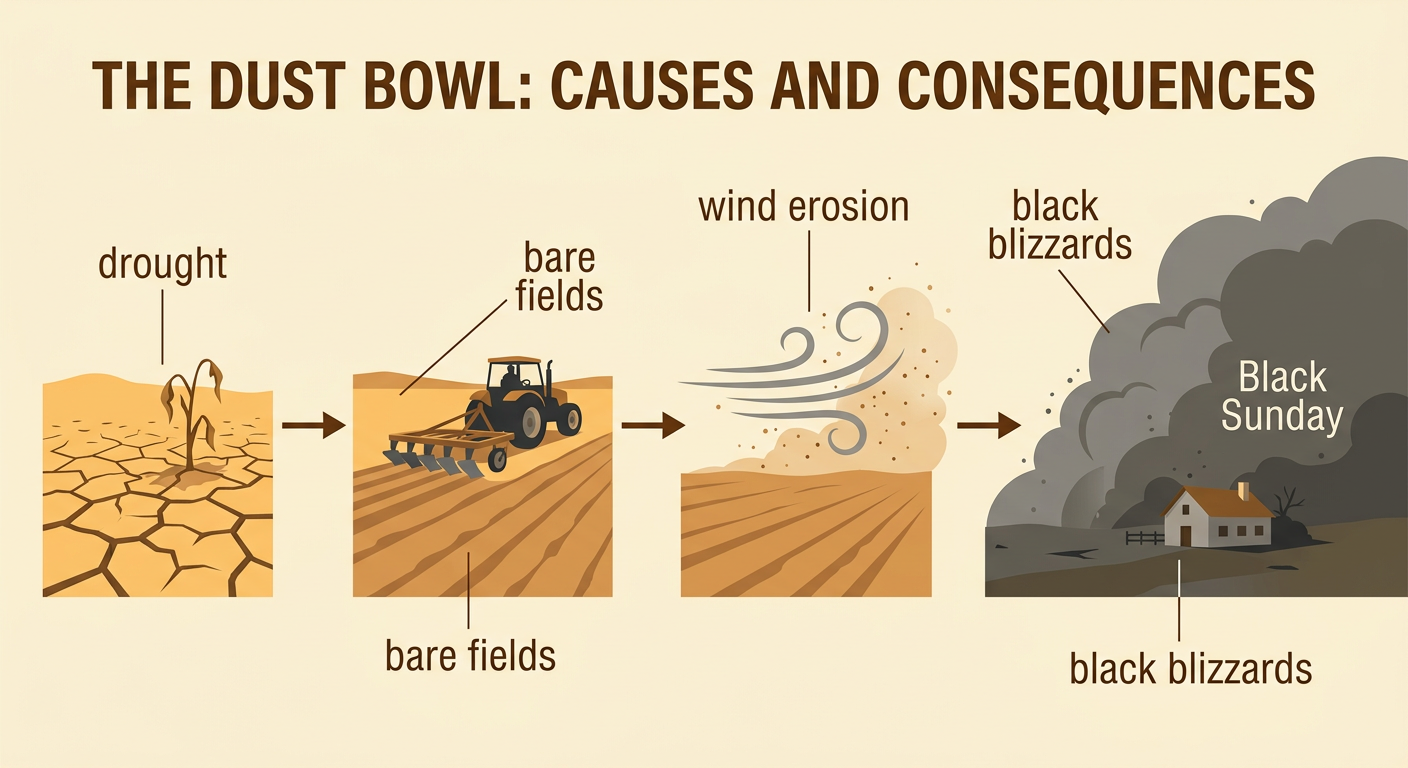
Severe drought began across parts of the Great Plains in 1930 and continued, with varying intensity, through much of the decade. With little rain, crops failed and uncovered soil became dry and loose. Strong winds lifted fine particles into the air, creating dust storms called black blizzards. Farming practices increased the damage: repeated plowing broke up soil structure, limited crop rotation reduced soil protection, and leaving fields bare allowed wind erosion. On April 14, 1935, known as Black Sunday, a massive dust storm darkened communities across the central and southern Plains. Drought was the natural hazard, but drought alone did not create the disaster. The interaction of climate conditions, fragile soils, extensive cultivation, and economic pressure turned a difficult dry period into a widespread environmental and human crisis.
Reading Environmental and Migration Data
Maps and graphs help historians test relationships among drought, soil erosion, and migration. Students can compare a map of severe wind erosion with county population changes from the 1930 to 1940 censuses. They can also make a scatter plot in which each point represents a county, the horizontal axis shows drought severity, and the vertical axis shows the percentage of residents who left. An upward pattern would indicate that greater drought severity was associated with greater out-migration. However, correlation does not prove that drought acted alone. For example, a severely affected county might show less migration because families lacked money to move, while a moderately affected county might lose many residents because farm foreclosures were high. Students should identify trends, clusters, and outliers, then use historical sources to explain why counties with similar environmental conditions sometimes had different outcomes.

Experiences of Displaced Families
Dust Bowl migration was not a single, uniform experience. Hundreds of thousands of people left the Plains and nearby states during the 1930s, although drought was only one cause among unemployment, debt, foreclosure, and changing farm technology. Many traveled west on U.S. Route 66 seeking agricultural work in California. The label “Okies” was often applied broadly and sometimes insultingly, even to migrants from Texas, Arkansas, Missouri, and other states. Dorothea Lange’s 1936 photograph commonly called Migrant Mother shows Florence Owens Thompson and her children in a California pea-pickers’ camp. The image communicates uncertainty and hardship, but it cannot by itself explain Thompson’s complete experience or represent every migrant family. Historians compare photographs with interviews, letters, newspapers, and government records to examine family decisions, discrimination, working conditions, resilience, and community support.

Evaluating New Deal Responses
The federal government responded to the Dust Bowl with programs addressing soil loss, farm income, and migrant relief. Created in 1935, the Soil Conservation Service promoted contour plowing, strip cropping, crop rotation, and other methods that reduced erosion. The Prairie States Forestry Project planted long rows of trees as windbreaks across parts of the Plains. Agricultural Adjustment programs paid some landowners to reduce production or retire fragile land, while the Farm Security Administration offered loans, documented poverty, and operated migrant labor camps. These efforts provided assistance and encouraged more sustainable land use, but their benefits were uneven. Some tenant farmers and sharecroppers lost work when landowners reduced acreage, and racial discrimination limited access for many families. No program could immediately end the drought. A fair evaluation therefore weighs measurable environmental improvements and relief against exclusions, displacement, cost, and limited reach.

Evidence-Based Causal Explanation
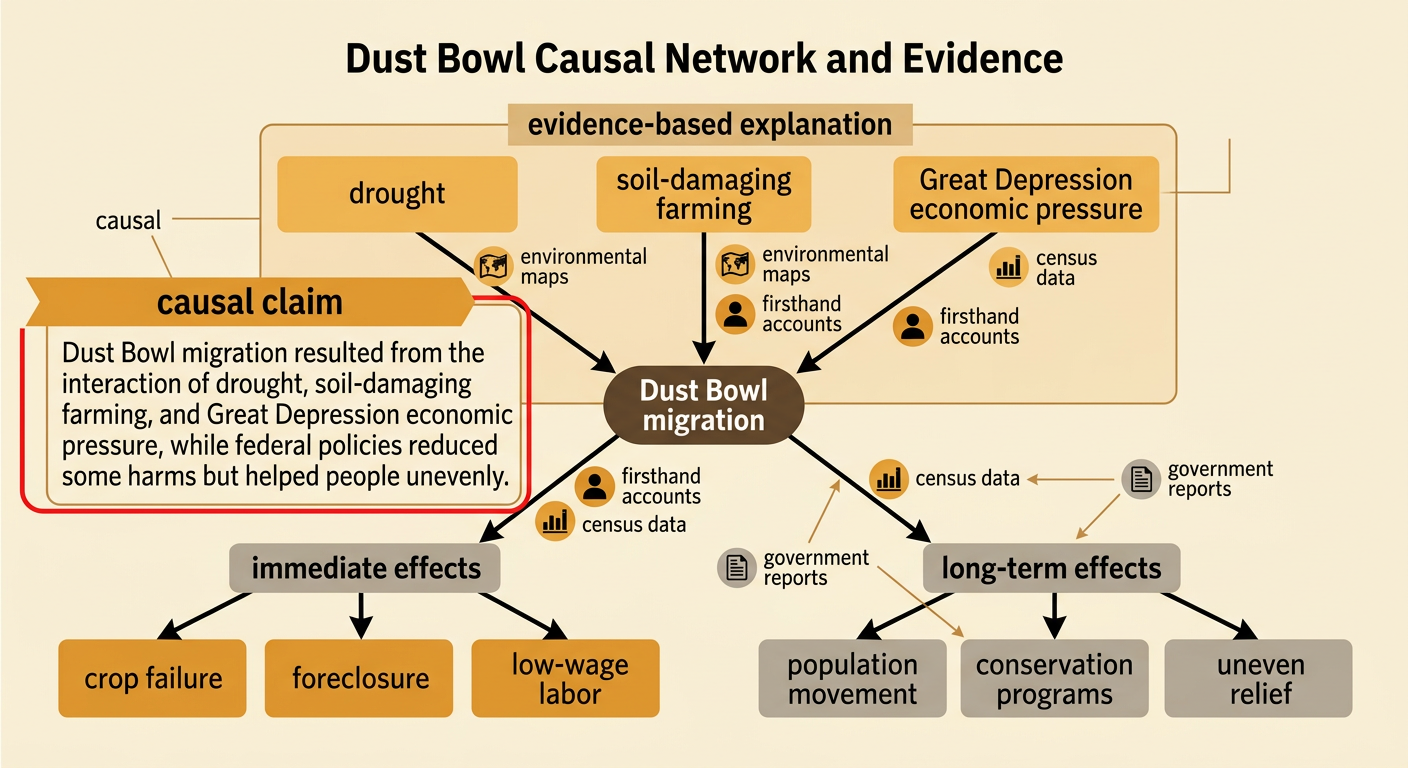
A strong causal explanation connects multiple causes, supporting evidence, and short- and long-term effects. A defensible claim might state that Dust Bowl migration resulted from the interaction of drought, soil-damaging farming practices, and Great Depression economic pressures, while federal policies reduced some harms but did not help everyone equally. Environmental maps can show where drought and erosion were severe. Census data can show population movement. Photographs and firsthand accounts can explain how families experienced crop failure, foreclosure, travel, and low-wage labor. Government reports can document conservation projects and relief programs. For example, evidence that a county experienced severe erosion and major population loss supports a connection, but a letter describing foreclosure may explain why a particular family left. Students should also address alternative explanations and source limitations. The conclusion should explain relationships rather than merely list events in chronological order.