
Tracking Carbon Through Ecosystems
Students interpret a carbon-cycle model and ecosystem data to explain how photosynthesis, cellular respiration, decomposition, and land-use decisions move carbon among Earth’s systems.

Illustrations are auto-generated and may be placeholders. They can be refreshed to match the narration.
Where Carbon Is Stored
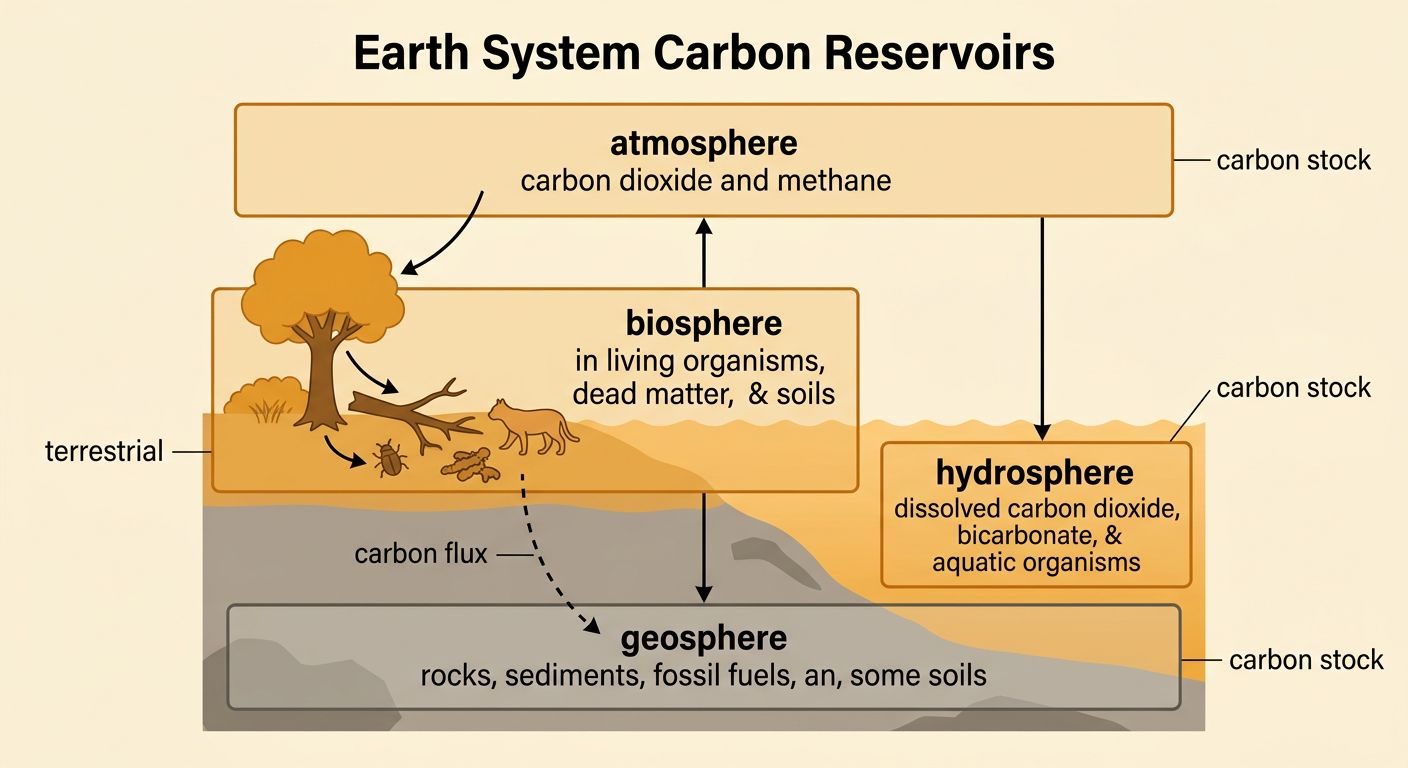
Carbon is stored in reservoirs within four connected Earth systems. The atmosphere contains carbon mainly as carbon dioxide and methane. The biosphere stores carbon in organisms, dead matter, and soils. The hydrosphere holds dissolved carbon dioxide, bicarbonate, and carbon in aquatic organisms. The geosphere contains carbon in rocks, sediments, fossil fuels, and some soils. Reservoir size is called a carbon stock, while movement between reservoirs is called a carbon flux. Stocks and fluxes must not be confused: a large reservoir may exchange carbon slowly. For example, a tree takes carbon dioxide from the atmosphere and stores the carbon in wood. When a branch falls, some carbon enters the soil; if it is buried and preserved for a very long time, some may eventually enter geologic storage.
Photosynthesis and Carbon Uptake
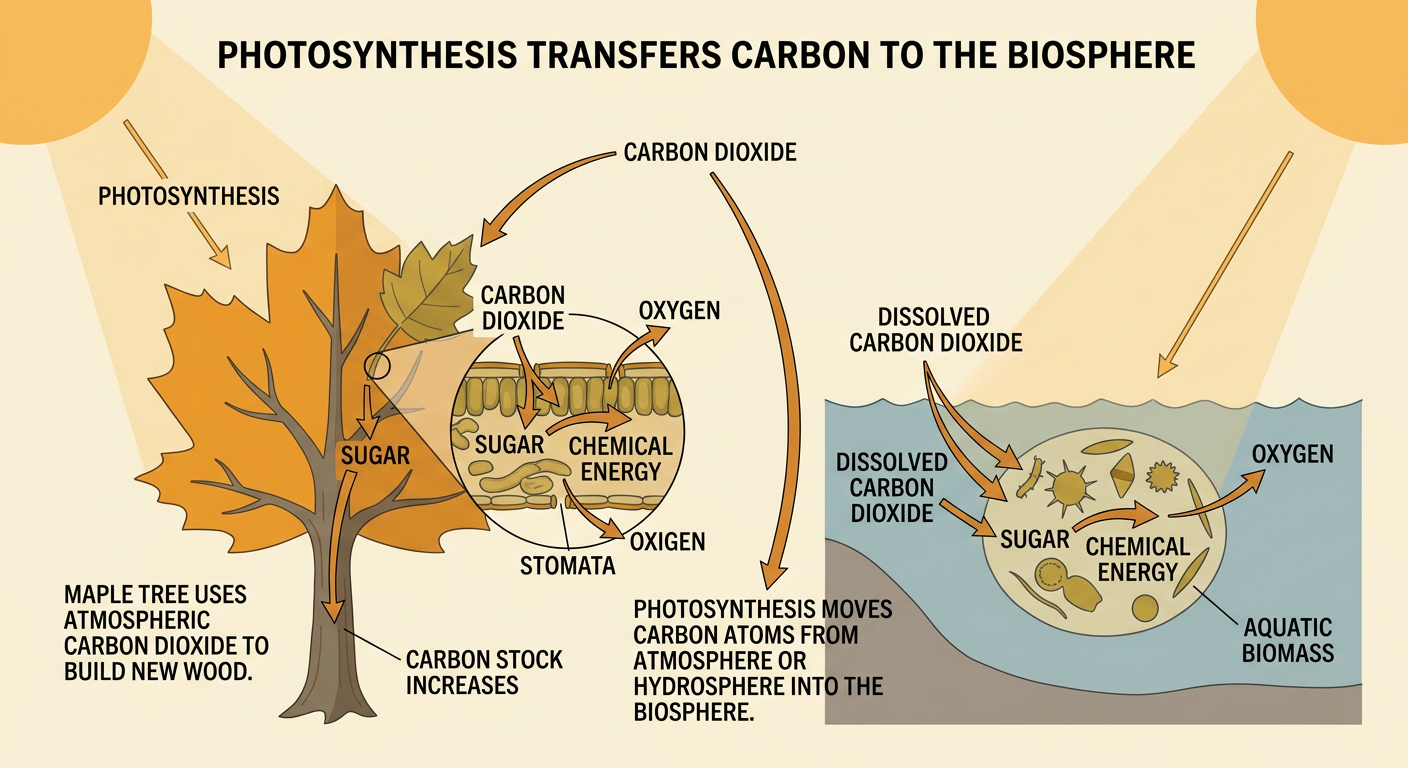
Photosynthesis moves carbon from the atmosphere or hydrosphere into the biosphere. Plants, algae, and some bacteria use light energy to combine carbon dioxide and water, producing energy-rich sugars and oxygen. The carbon atoms in those sugars can become cellulose, fats, proteins, and other biological molecules. On land, carbon dioxide enters leaves through small openings called stomata. In water, algae and phytoplankton use dissolved carbon dioxide and bicarbonate. For example, a growing maple tree uses atmospheric carbon dioxide to build new wood. Its carbon stock increases as long as photosynthetic carbon uptake exceeds carbon released through respiration, tissue loss, and decay. Photosynthesis does not destroy carbon; it changes the carbon’s location and chemical form while transferring solar energy into stored chemical energy.
Respiration and Decomposition
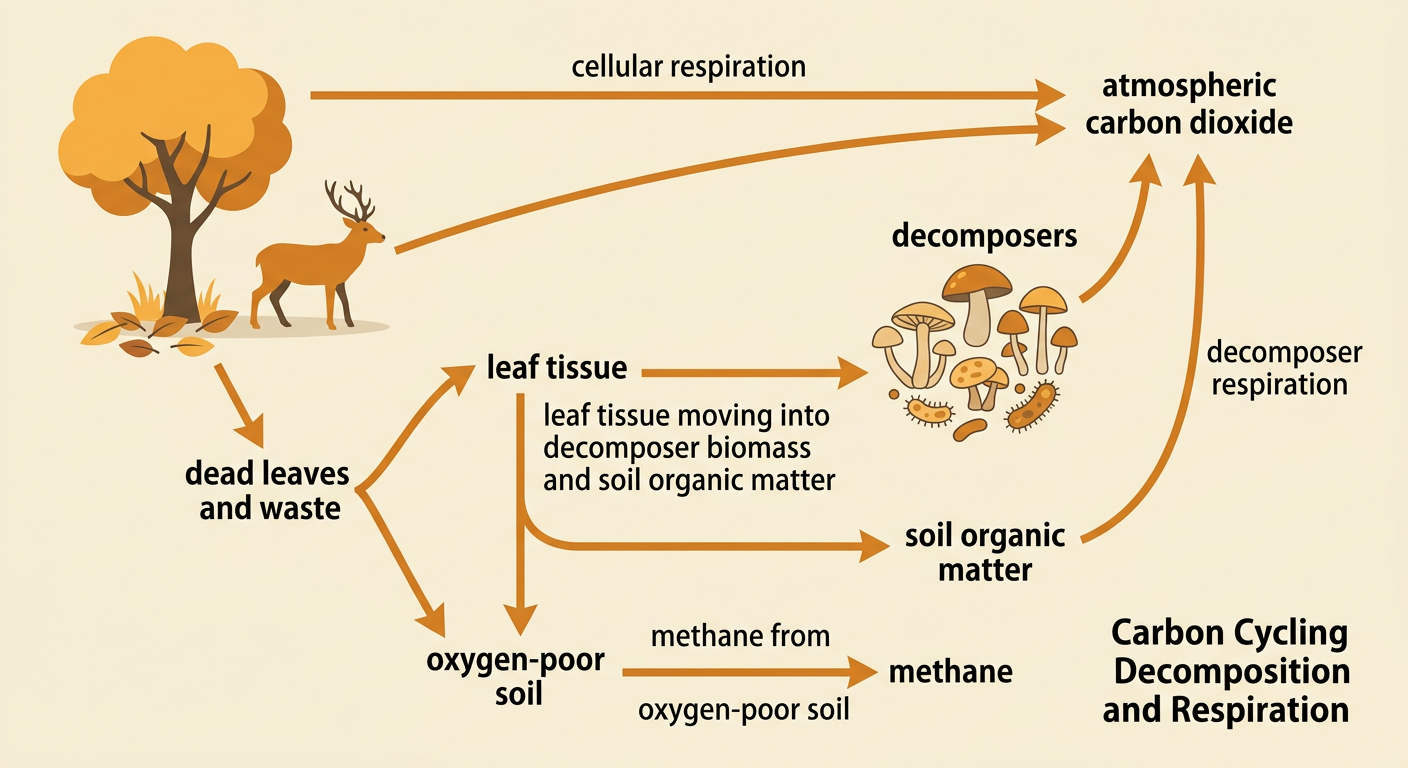
Cellular respiration releases usable energy from organic molecules and returns carbon dioxide to the atmosphere or water. Plants, animals, fungi, and many microorganisms perform respiration. In oxygen-rich conditions, cells use sugar and oxygen to produce carbon dioxide, water, and usable chemical energy. Decomposers obtain organic carbon by breaking down dead organisms and wastes. Much of that carbon is released through decomposer respiration, while some remains in soil organic matter. In waterlogged soils or oxygen-poor sediments, decomposition can also produce methane. For example, when autumn leaves fall, fungi and bacteria digest them. Carbon moves from leaf tissue into decomposer biomass, soil, carbon dioxide, and sometimes methane. If decomposition is slow, as in cold peatlands, organic carbon can accumulate for centuries and may eventually contribute to long-term geosphere storage.
Interpreting Carbon-Flux Data
Carbon-flux data show the rate and direction of carbon movement, so units and arrow directions are essential. Consider a forest measured in metric tons of carbon per hectare per year. If photosynthesis removes 18 tons from the atmosphere, plant respiration returns 8 tons, and decomposition returns 7 tons, the net change is 18 minus 8 minus 7, or 3 tons stored per hectare per year. A graph of these rates may reveal seasonal patterns: uptake rises during spring, reaches a summer maximum, and falls during winter. When interpreting the function, identify its maximum, minimum, intervals of increase or decrease, and where net flux equals zero. Also compare the graph with a data table and model arrows. A positive storage value means the ecosystem is a carbon sink under the stated sign convention.
Modeling Land-Use Impacts
Land-use decisions can change both carbon stocks and fluxes. Clearing a forest transfers carbon from vegetation to harvested products, soils, and the atmosphere through burning and decomposition. It also reduces future photosynthetic uptake until vegetation regrows. For example, converting forest to cattle pasture may provide jobs, food, and tax revenue, but it can release stored biomass carbon, disturb soil carbon, and alter regional water and habitat conditions. Political choices such as zoning, road construction, conservation rules, and financial incentives influence where conversion occurs. A useful model compares alternatives, marks system boundaries, and uses arrows to show carbon transfers over time. Reforestation may increase biological storage, while protecting mature forests avoids immediate emissions. Evaluation should include economic benefits, community needs, land ownership, time scale, and measured environmental consequences rather than assuming one policy has only benefits or only costs.