
Tracking Patterns in Sunlight and Shadows
Students analyze and graph shadow measurements to explain how shadow length and direction change in predictable patterns throughout the day.
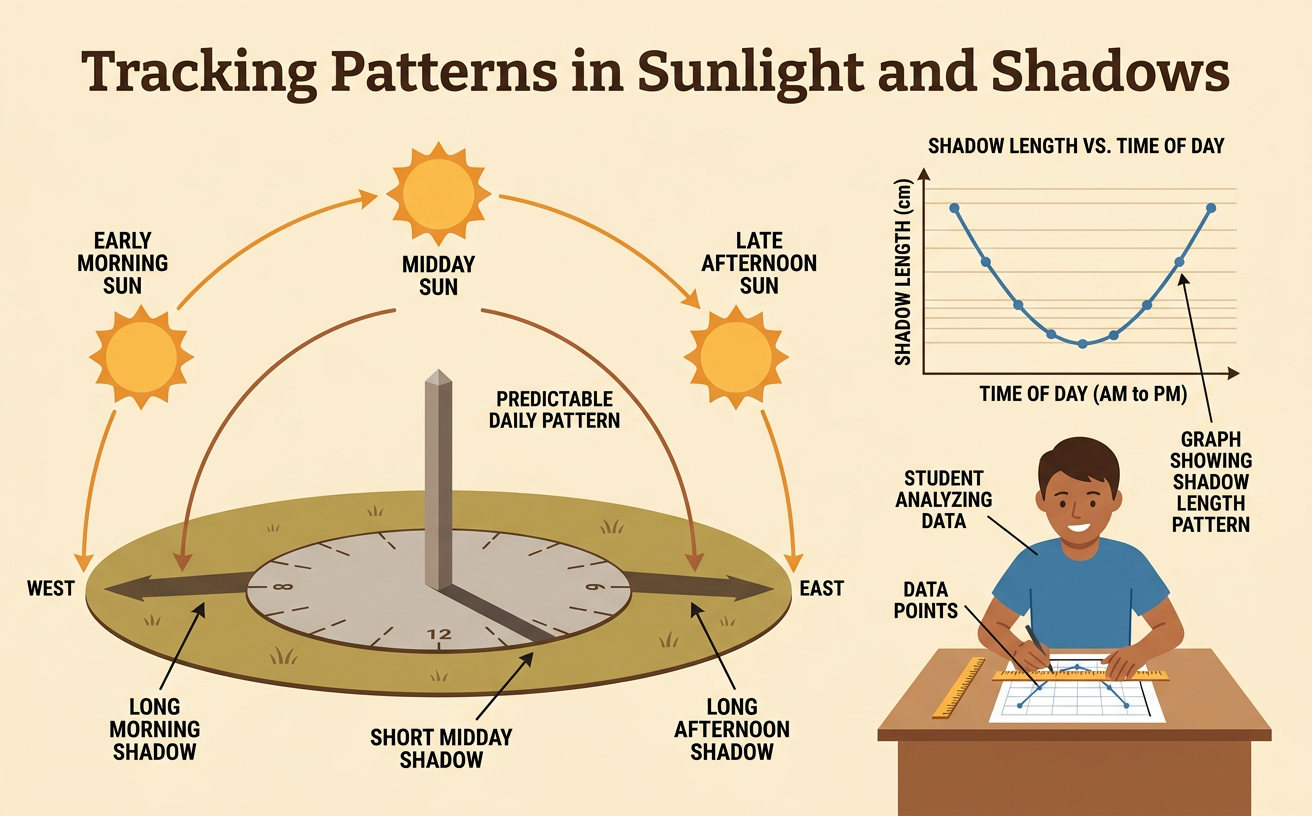
Illustrations are auto-generated and may be placeholders. They can be refreshed to match the narration.
Observe a Changing Shadow
Place a straight meter stick upright in the same sunny location several times during one day. At each observation, mark the tip of its shadow, measure the shadow from the base of the stick to the tip, and record the time. Also use a compass or a map with north marked to record the direction in which the shadow points. For example, at 9:00 a.m., a one-meter stick might make a 150-centimeter shadow pointing generally west. Around midday, its shadow may be much shorter. Never look directly at the Sun. Keep the stick and measuring method the same so the observations can be compared fairly. A photograph, measurement table, and position map provide different kinds of evidence about how the shadow changes.

Compare Time and Position Data
Organize observations in a table with columns for time, shadow length, and shadow direction. Then compare the table with photographs or a map of the marked shadow tips. Suppose the records show 140 centimeters west at 9:00 a.m., 75 centimeters northwest at 11:00 a.m., 45 centimeters north at 1:00 p.m., and 110 centimeters east at 4:00 p.m. The table makes exact measurements easy to find, while the map shows where each shadow tip was located. Check that every map point has a time label and that all measurements use the same unit. Using several sources helps answer questions efficiently. For example, the table identifies the shortest shadow, and the position map shows how the shadow rotated around the stick.

Graph Shadow Measurements
A line graph can reveal how shadow length changes over time. Place time on the horizontal x-axis and shadow length in centimeters on the vertical y-axis. Both axes use positive values, so the points lie in the first quadrant. Choose equal intervals, such as one hour on the x-axis and 25 centimeters on the y-axis. Plot each measurement as an ordered pair. For example, a measurement of 100 centimeters at 10:00 a.m. becomes a point above 10:00 and across from 100. Plot all points and connect them in time order. The graph may slope downward toward midday and upward later in the afternoon. Include a title, axis labels, units, and an even scale so another student can read the graph accurately.

Identify Daily Patterns
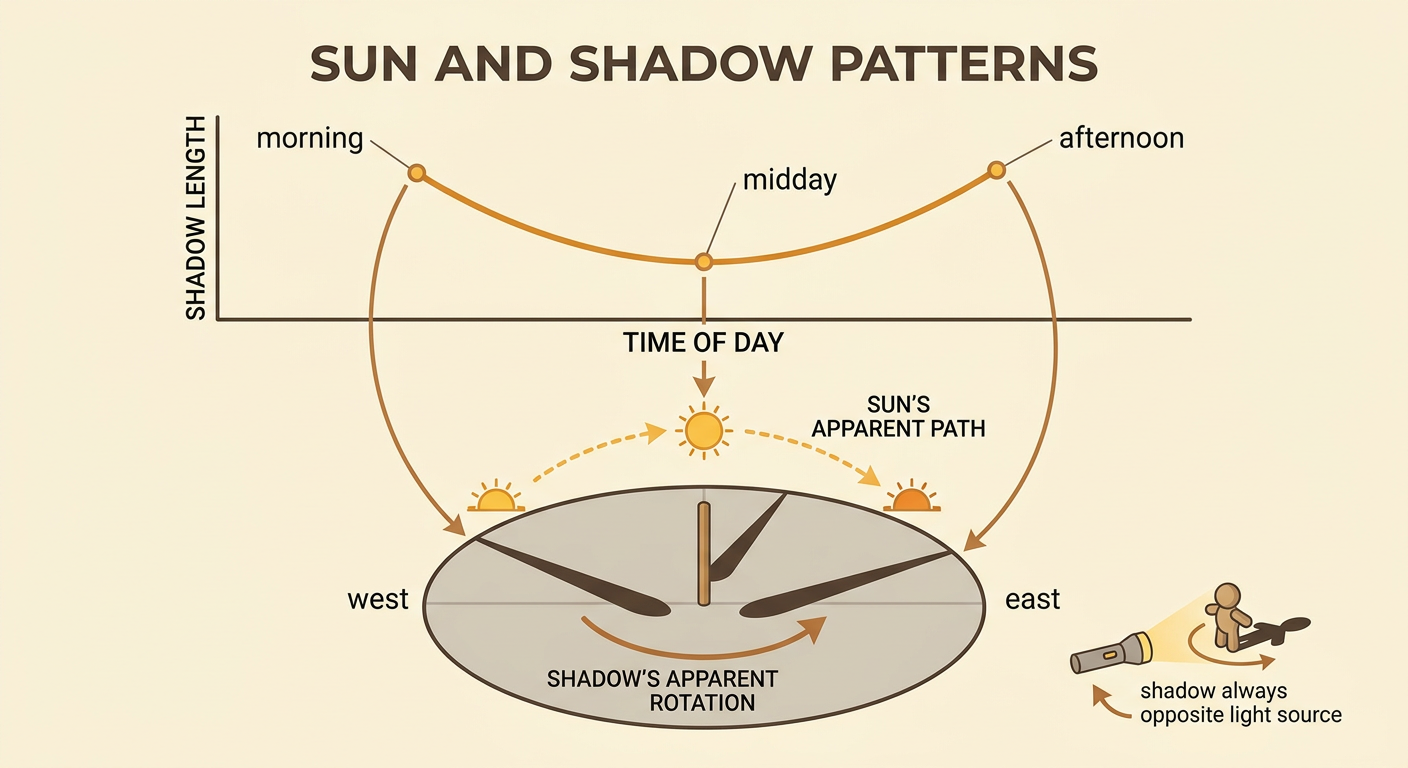
Look for repeated changes in both the graph and the position map. A typical daily pattern is that shadows are long in the morning, become shorter as the Sun rises higher, reach their shortest length near the middle of the day, and grow longer as the Sun gets lower in the afternoon. Shadow direction also changes in an orderly way. When the Sun appears in the eastern sky during morning, a shadow points generally west. As the Sun appears to move across the sky, the shadow turns. When the Sun is in the western sky during afternoon, the shadow points generally east. Weather, season, and location can affect the exact measurements, but observations made on clear days still show a predictable pattern. Similar results on several days provide stronger evidence than one measurement alone.
Explain the Sun-Shadow Relationship
A shadow forms when an opaque object blocks sunlight. Sunlight travels in straight lines, so the shadow appears on the side opposite the Sun. In the morning, the Sun looks low in the eastern sky, and its light strikes objects at a low angle. This produces a long shadow toward the west. Near midday, the Sun is higher in the sky, so the light reaches the ground at a steeper angle and makes a shorter shadow. In the afternoon, the Sun looks lower in the western sky, producing a longer shadow toward the east. The Sun appears to move because Earth rotates. Earth turns from west to east, making the Sun seem to travel from east to west. The measurements, graph, and map together provide evidence for this Sun-shadow relationship.
