Urban Heat, Zoning, and Environmental Justice
Students analyze temperature maps, demographic data, and zoning policies to evaluate how local governments can address unequal exposure to extreme urban heat.

Illustrations are auto-generated and may be placeholders. They can be refreshed to match the narration.
What Creates an Urban Heat Island?
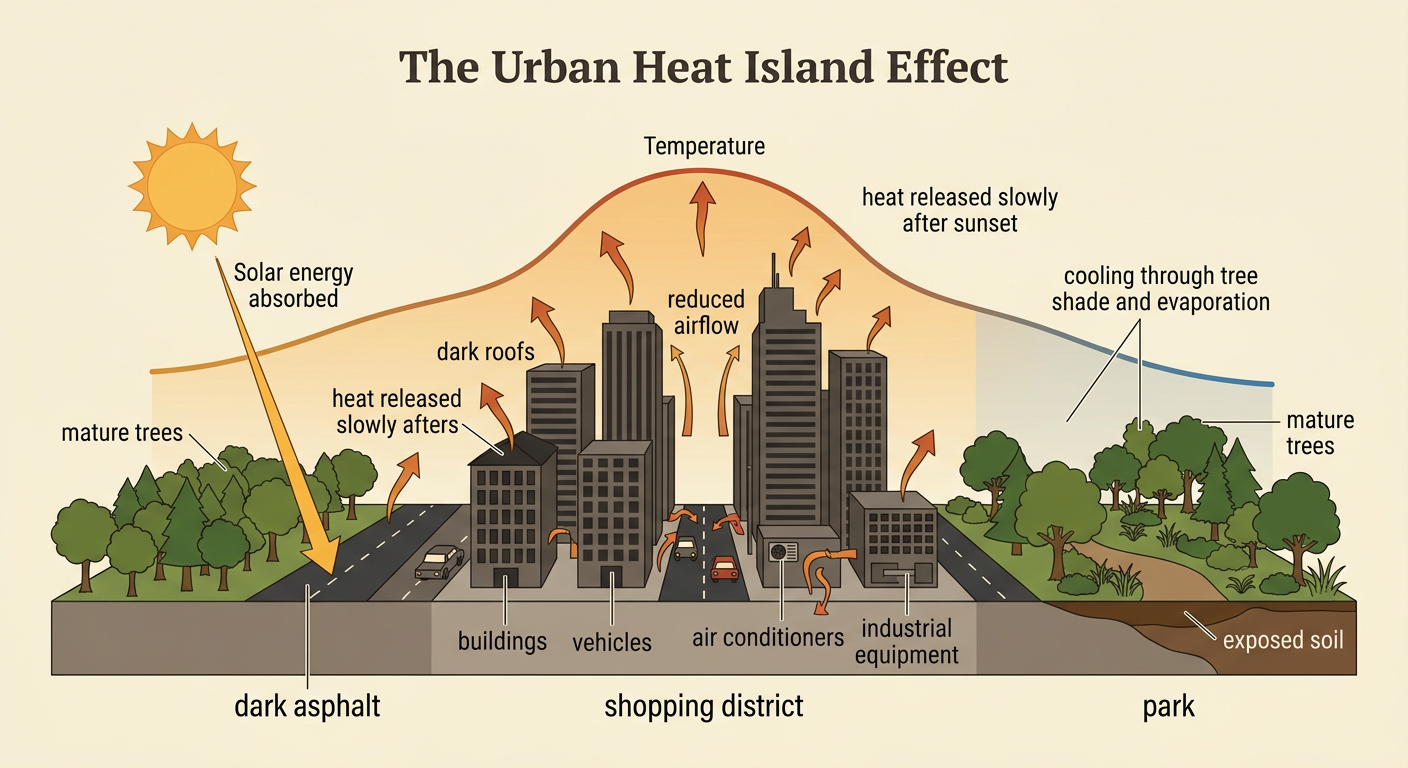
An urban heat island occurs when a city is warmer than nearby rural or less-developed areas. Dark roofs and asphalt absorb solar energy during the day and release heat slowly after sunset. Buildings can reduce airflow, while vehicles, air conditioners, and industrial equipment add waste heat. Cities also tend to have fewer trees and less exposed soil, so they receive less cooling from shade and evaporation. The effect varies by location and time; it is often strongest on clear, calm nights. For example, a paved shopping district may remain several degrees warmer at night than a nearby park with mature trees. Extreme heat can raise energy costs and increase health risks, especially for people without air conditioning or access to shaded outdoor spaces.
Mapping Heat and Demographic Inequality
To evaluate unequal heat exposure, researchers combine several kinds of evidence. Satellite maps estimate land-surface temperature, weather stations measure air temperature, census data describe population characteristics, and neighborhood maps show trees, pavement, housing, and public facilities. These sources measure different things, so they should not be treated as interchangeable. For example, a satellite image may show that one census tract has hotter roofs and roads, while census data show that the same tract has more low-income households and older adults. That overlap identifies a possible priority area, but it does not prove that income caused the heat. Students should compare map dates, geographic boundaries, measurement methods, and missing data. They should also examine whether residents have air conditioning, cooling centers, reliable transportation, and safe access to shade.

How Zoning Shaped Neighborhood Conditions
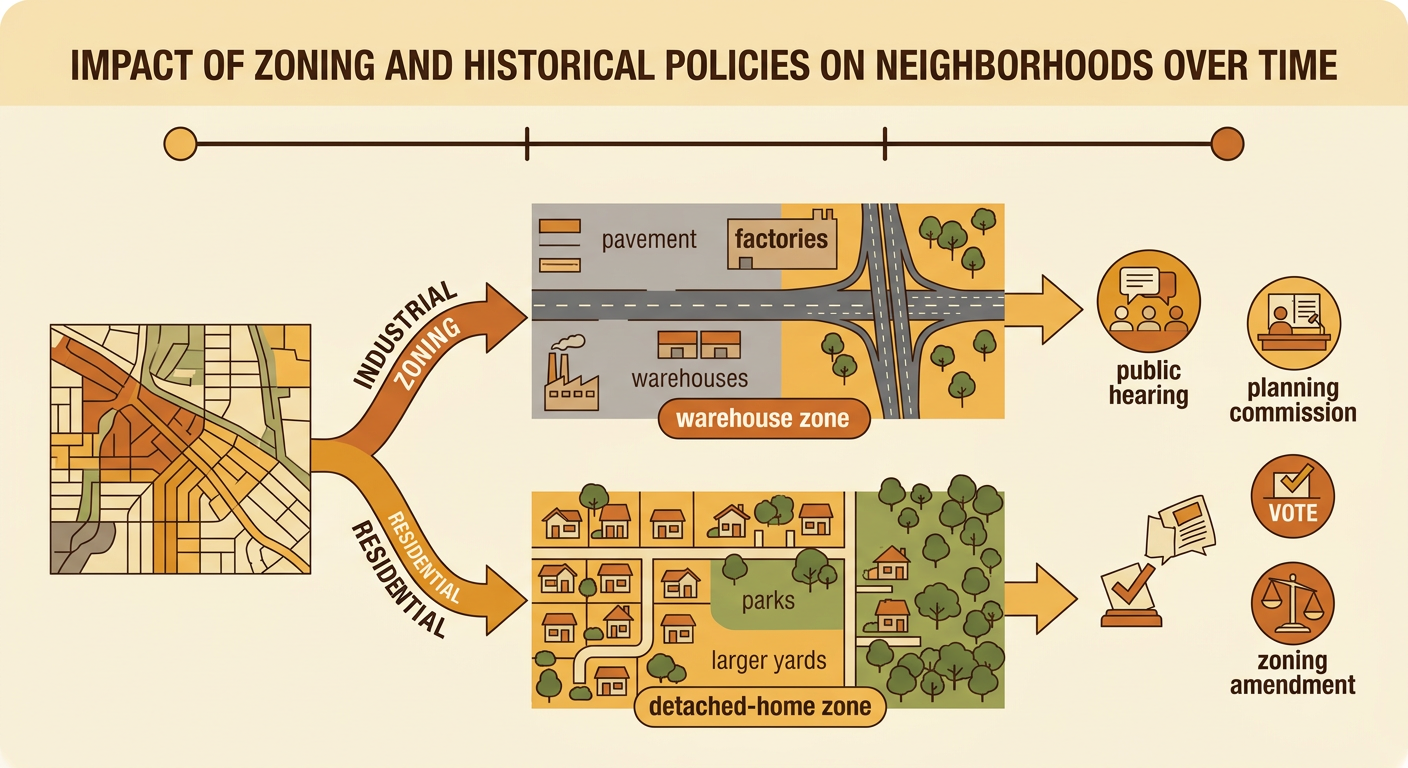
Zoning laws regulate how land may be used, including building height, lot size, housing density, parking, and industrial activity. Over decades, these rules can shape heat exposure by influencing where pavement, factories, highways, homes, parks, and trees are located. Some cities also used racially discriminatory housing policies, restrictive covenants, urban renewal, and highway construction to exclude or displace communities, even though several of these practices later became illegal. Their physical effects can remain. For example, a neighborhood zoned for warehouses and large parking lots may have fewer trees and hotter surfaces than a neighborhood protected for detached homes with larger yards. Residents can challenge current conditions through public hearings, planning commissions, lawsuits, elections, and requests for zoning amendments. Historical evidence should be connected carefully to present-day land use rather than assuming every difference has one cause.
Comparing Local Policy Solutions
Local governments can compare heat policies by effectiveness, cost, speed, durability, environmental effects, and fairness. Tree planting provides shade and cooling but requires years of growth, water, maintenance, and suitable planting space. Cool roofs reflect more sunlight and can lower building temperatures, but benefits depend on roof condition, climate, and installation quality. Shade structures and cooling centers can protect people sooner, although centers must be open, accessible, and supported by transportation. Zoning changes can require trees, reflective materials, reduced parking, or heat reviews for new development. For example, a city might compare a cool-roof requirement for large warehouses with a voluntary rebate. The requirement may reach more buildings, while the rebate may be easier to adopt but may favor owners able to pay upfront. A strong evaluation also checks for unintended effects, such as rent increases or tree maintenance burdens.

Evidence-Based City Council Recommendation
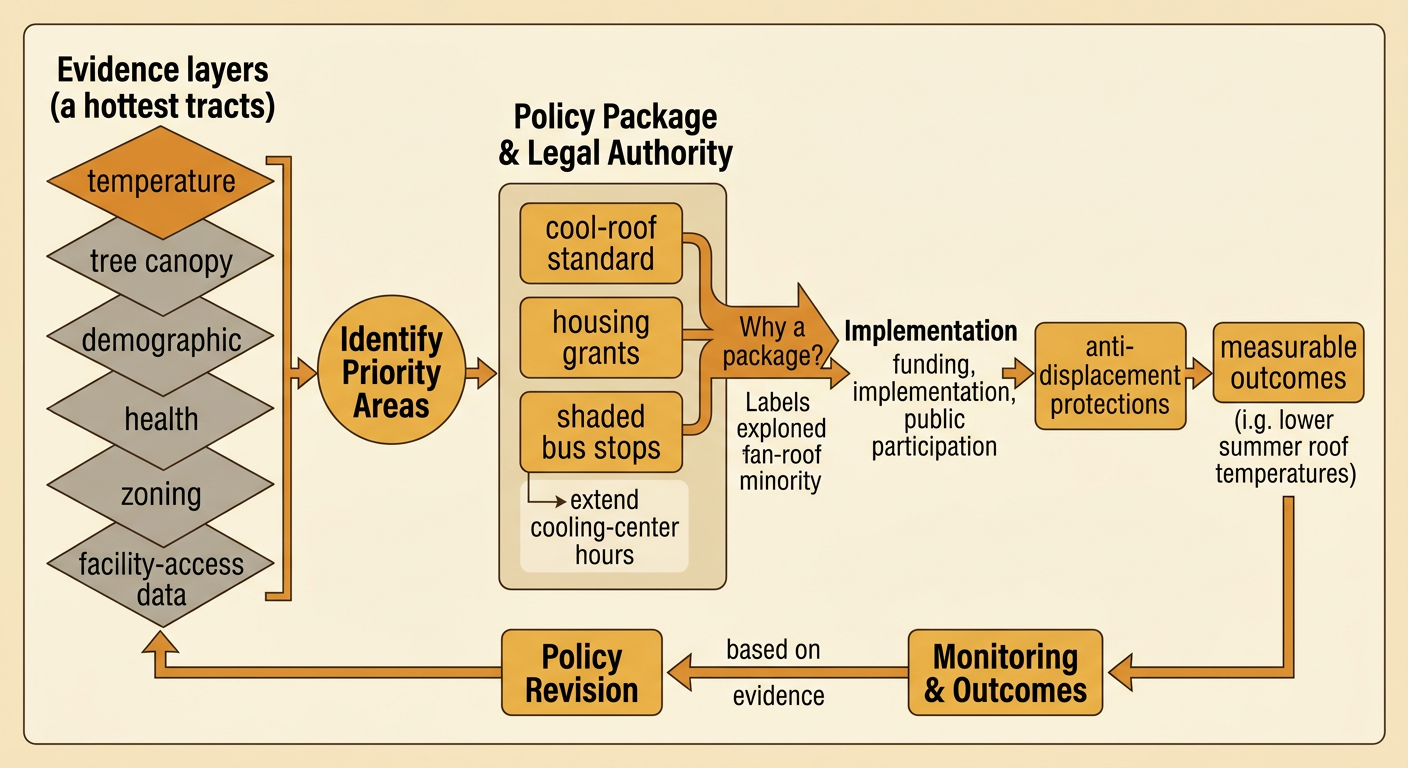
A city council recommendation should make a clear claim, integrate multiple sources, explain trade-offs, and identify how success will be measured. Begin by locating priority areas using temperature, tree-canopy, demographic, health, zoning, and facility-access data. Then recommend an action that matches the evidence and government authority. For example, students might propose a cool-roof standard for new warehouses, grants for existing low-income housing, shaded bus stops, and expanded evening cooling-center hours in the hottest tracts. The recommendation should explain funding, implementation, public participation, and protections against displacement or rising housing costs. It should also include measurable outcomes, such as lower summer roof temperatures, increased shaded transit access, and fewer heat-related emergency visits. Finally, acknowledge uncertainty: satellite temperature does not measure personal exposure, and future evaluation should include air sensors, resident testimony, and updated health data.