
Using Motion Patterns to Make Predictions
Students observe and measure repeated motions, identify patterns, and use those patterns to predict how an object will move next.
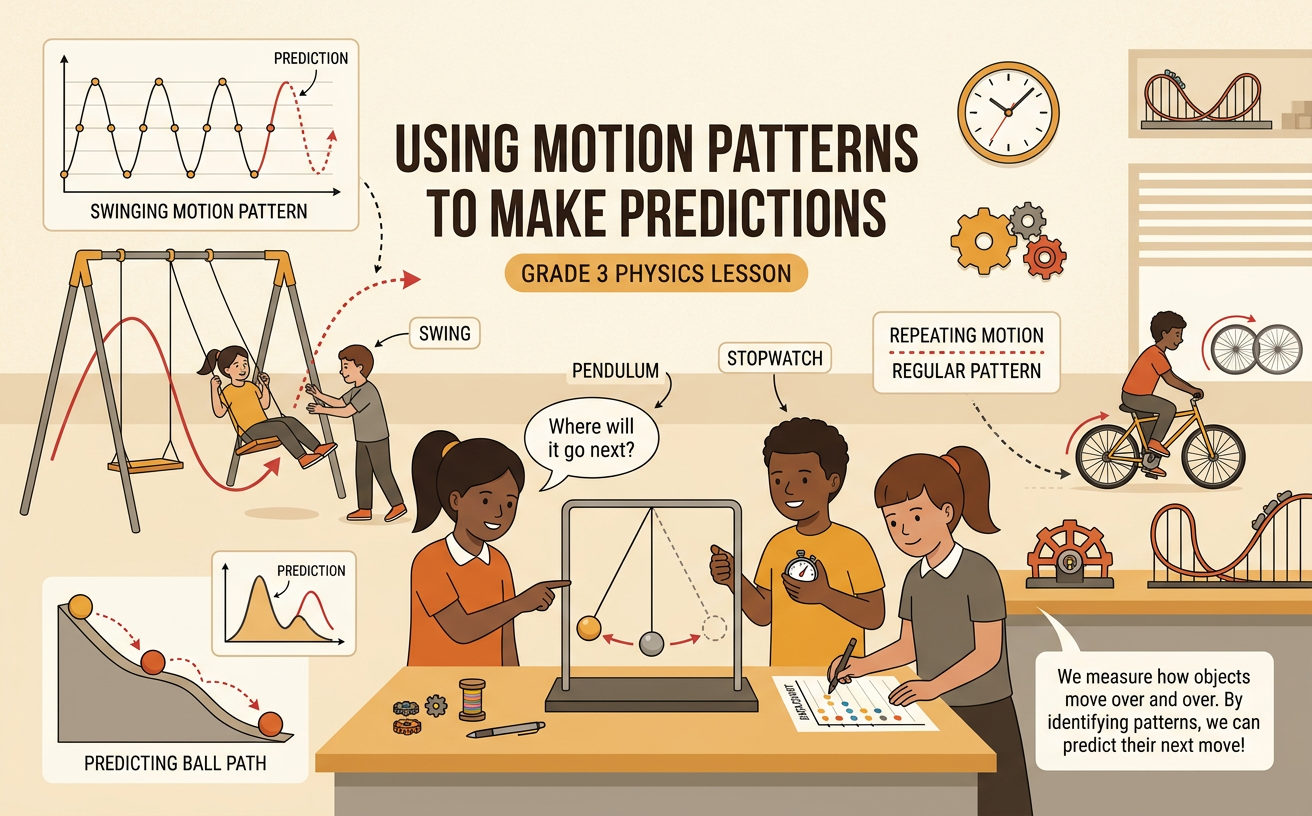
Illustrations are auto-generated and may be placeholders. They can be refreshed to match the narration.
Observe Repeating Motions
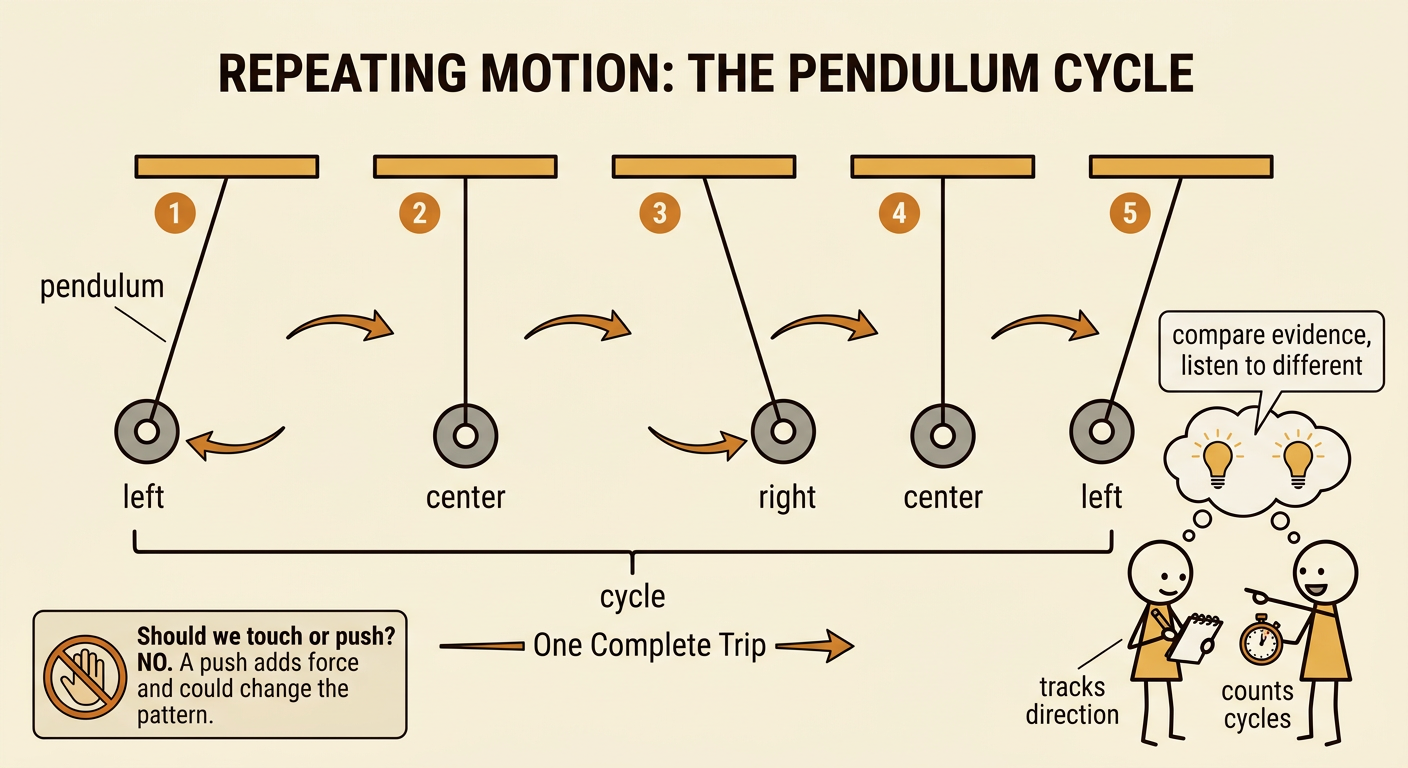
A repeating motion happens again and again in a similar order. Watch a playground swing or a pendulum made from a washer tied to a string. The object moves from one side, through the center, to the other side, and back again. This makes one cycle. Observe several cycles before deciding that a pattern exists. You can describe the pattern with words such as left, center, right, center, left. You can also notice whether each cycle takes about the same amount of time. Work with classmates to compare observations. One student might track direction while another counts cycles. Share evidence and listen carefully to different ideas. Do not touch or push the object while observing because an extra force could change its motion pattern.
Measure and Record Movement
Measurements give stronger evidence than observations alone. To measure a pendulum, one student can release it from the same marked starting point while another uses a stopwatch. Count five complete cycles and record the total time to the nearest second. Repeat the test several times without changing the string length or starting point. For example, four trials might take 10 seconds, 11 seconds, 10 seconds, and 10 seconds. Make a data table with a row for each trial. Include the number of cycles and the measured time. Using the same procedure makes the trials easier to compare. If the pendulum receives a new push or starts from a different point, note that change because it may affect the results. Take turns measuring, counting, recording, and checking the data.

Find Patterns in the Data
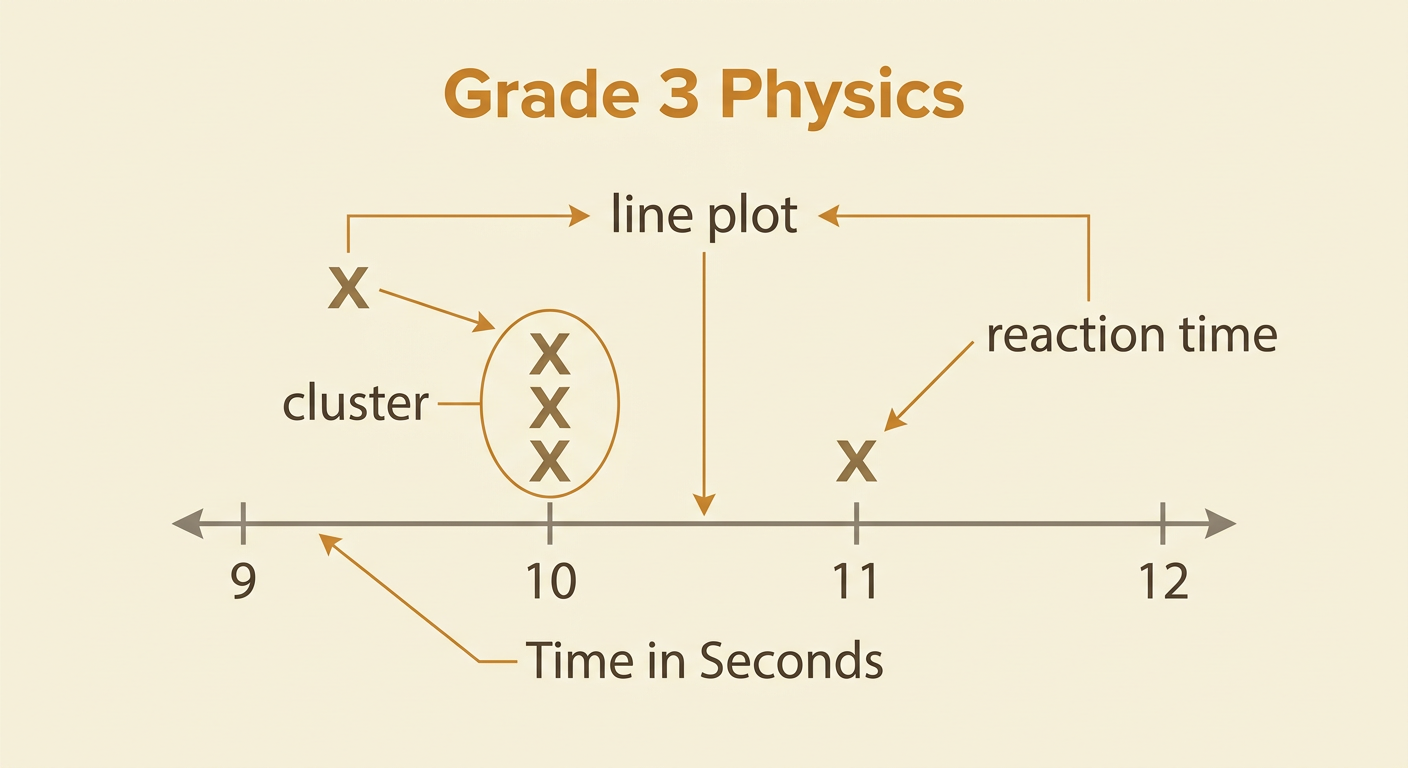
Organize the measurements to make patterns easier to see. A line plot can show the time for each five-cycle pendulum trial. Draw a number line labeled Time in Seconds. Place one X above the number that matches each measurement. For the times 10, 11, 10, and 10 seconds, place three Xs above 10 and one X above 11. The cluster of Xs shows that most trials took 10 seconds. The small difference may come from reaction time when starting or stopping the stopwatch. Discuss what the data show with your group. Use evidence by saying, “Three of four trials took 10 seconds.” Do not claim that every trial must be exactly the same. The data support the idea that five cycles usually take about 10 seconds under the same conditions.
Predict What Happens Next
A prediction tells what you think will happen next based on evidence. Suppose a pendulum follows the position pattern left, center, right, center, left. If it keeps moving under the same conditions, the next observed position in the pattern will be center, followed by right. Time measurements can support another prediction. If five cycles usually take about 10 seconds, you can predict that the next five cycles will also take about 10 seconds. State both the prediction and the evidence: “I predict five cycles will take about 10 seconds because three of four trials took 10 seconds.” Then test the prediction and add the new measurement to the line plot. A prediction may not be exact. Air movement, a different push, or a changed string length can alter the motion.

Connect Motion Predictions to Transportation
People also use motion patterns to predict transportation. A city bus may travel the same route and reach certain stops at similar times each weekday. Riders use that pattern to predict when the bus will arrive. Measurements such as travel times can be recorded and compared, just like pendulum data. However, transportation patterns are affected by places and people. Mountains, rivers, snow, and heavy rain can slow movement or change routes. Communities may build roads near homes, schools, markets, or important cultural gathering places. Work schedules and community events can change when many people travel. For example, a bus that usually takes 12 minutes between two stops may take longer during a snowstorm or festival. A useful prediction uses past evidence while also considering current environmental and cultural conditions.
