
Weather Data Detectives
Students enter simple weather observations into a class data chart, use symbols to represent categories, and identify patterns in the displayed data.

Illustrations are auto-generated and may be placeholders. They can be refreshed to match the narration.
Introduce Weather as Data
Weather tells us what the air and sky are like outside. We can observe the weather each day and save what we notice as data. Data are pieces of information that we collect. Look outside at the same time each school day. Notice whether the sky is sunny, cloudy, or rainy. You might also notice wind or temperature, but our first chart will use only three sky categories. For example, on Monday morning, Mia sees a bright sun and no clouds. She records Monday as sunny. On Tuesday morning, she sees the sky covered with clouds, so she records cloudy. Observing at the same place and time helps us compare days fairly. After several days, our weather data can show what our local weather has been like over time.

Choose Weather Symbols
A symbol is a small picture that stands for an idea. Symbols help us enter weather data quickly and make a chart easy to read. Our class can use a yellow sun for sunny, a gray cloud for cloudy, and a blue cloud with drops for rainy. Before using the chart, make a key. A key explains what each symbol means. For example, if Wednesday is rainy, place one rain symbol in the Wednesday row. Use only one symbol for the sky category you observe that day. Everyone should use the same symbols so the data stay clear. Look carefully at the key whenever you are unsure. A symbol does not tell every detail about the day, but it places the observation into one useful category.

Enter Observations in a Chart
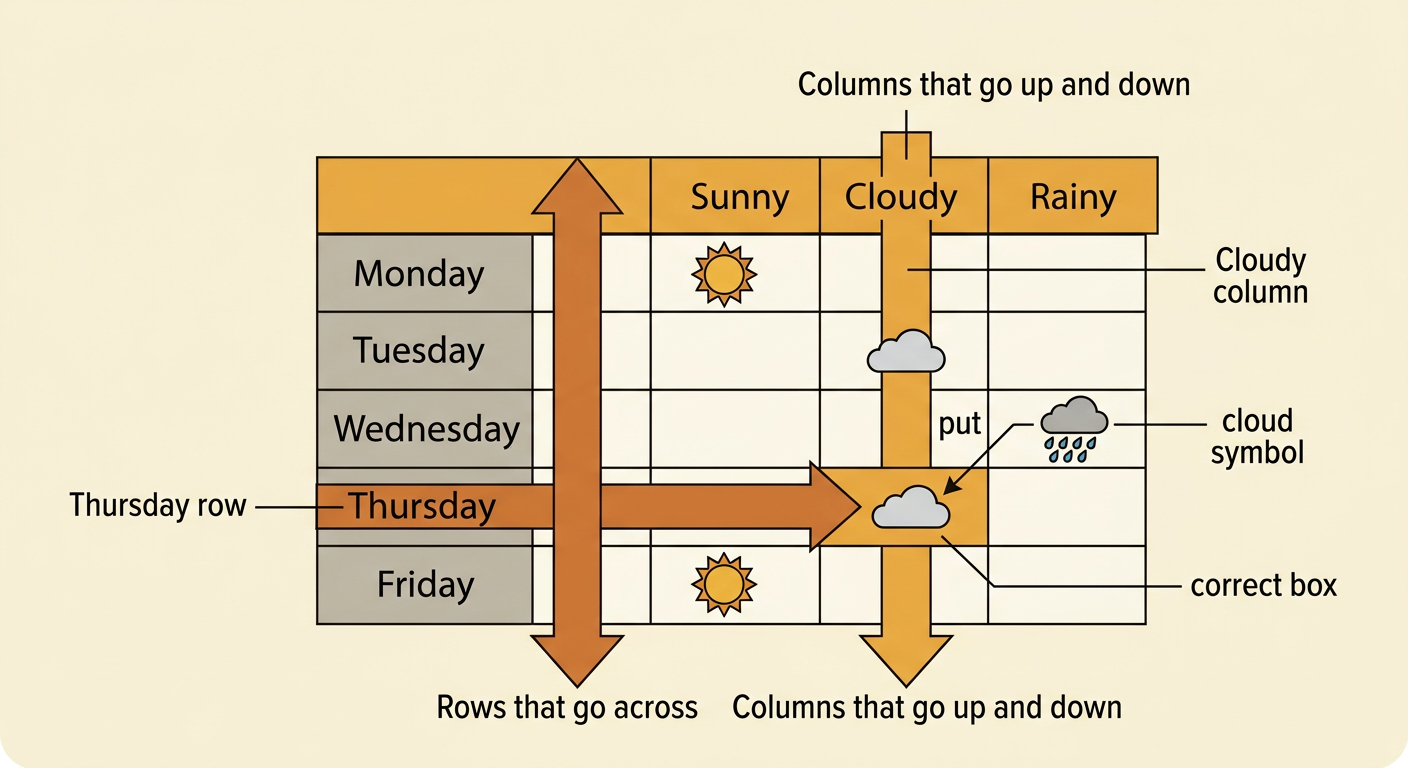
A data chart keeps observations organized. Each row can show one day, and each weather category can have its own column. First, find the row for today. Next, look outside and choose the symbol that matches the sky. Then place one mark in the correct box. Suppose it is Thursday and the sky is cloudy. Find the Thursday row and the Cloudy column. Put one cloud symbol where that row and column meet. Do not add a symbol to the Sunny or Rainy box for that day. Check your entry by saying, “Thursday was cloudy.” Over five school days, the chart will have five symbols, one for each day. An organized chart helps the class see when each kind of weather happened in our local place.
Count and Compare Categories
After we collect several days of data, we can count each weather category. Count the sun symbols first, then the cloud symbols, and then the rain symbols. Write each total beside its category. Imagine our five-day chart has two sunny days, two cloudy days, and one rainy day. Sunny and cloudy have the same number, so they are equal. Both have more days than rainy. Rainy has one fewer day than sunny and one fewer day than cloudy. We can answer questions by using the chart: Which categories have the most days? Sunny and cloudy do. Which has the fewest days? Rainy does. Counting and comparing help us interpret, or understand, the information. Point to each symbol once as you count so you do not skip or count it twice.

Find and Share a Pattern
A pattern is something that repeats or happens more often in data. Look across the chart and ask what you notice. In our example, there were two sunny days, two cloudy days, and one rainy day. One pattern is that dry sky categories happened more often than rainy weather. Another pattern might be an order that repeats, such as sunny, cloudy, sunny, cloudy. Use the chart as evidence when you share a pattern. You could say, “I notice that rain happened only once because the chart has one rain symbol.” You can also describe the place: “Our school had more sunny and cloudy days than rainy days this week.” A chart for one week describes only that week. Collecting observations for many weeks can help us find stronger local weather patterns over time.
