
Weather Patterns Across the Seasons
Students read weather data, create or interpret a graph, and identify seasonal weather patterns that affect people’s activities.
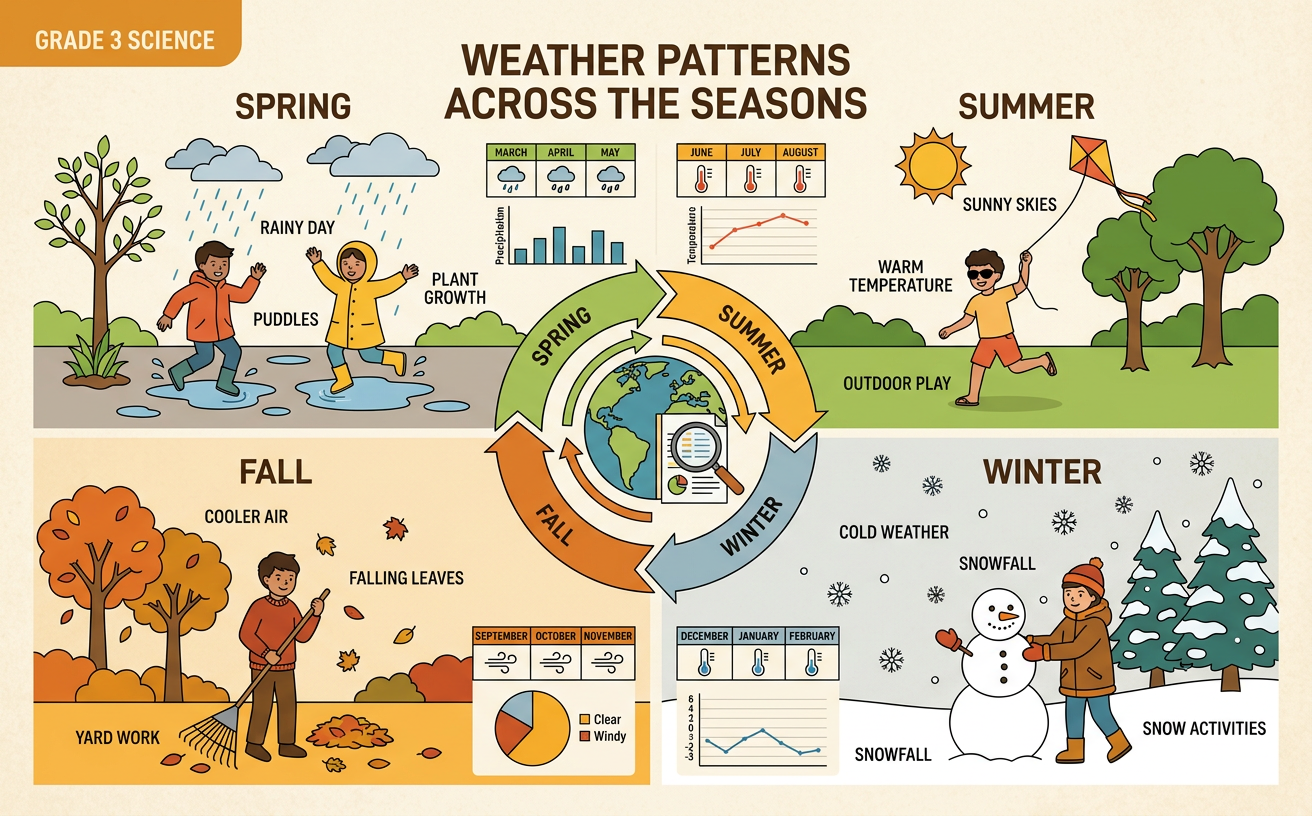
Illustrations are auto-generated and may be placeholders. They can be refreshed to match the narration.
Notice Daily Weather
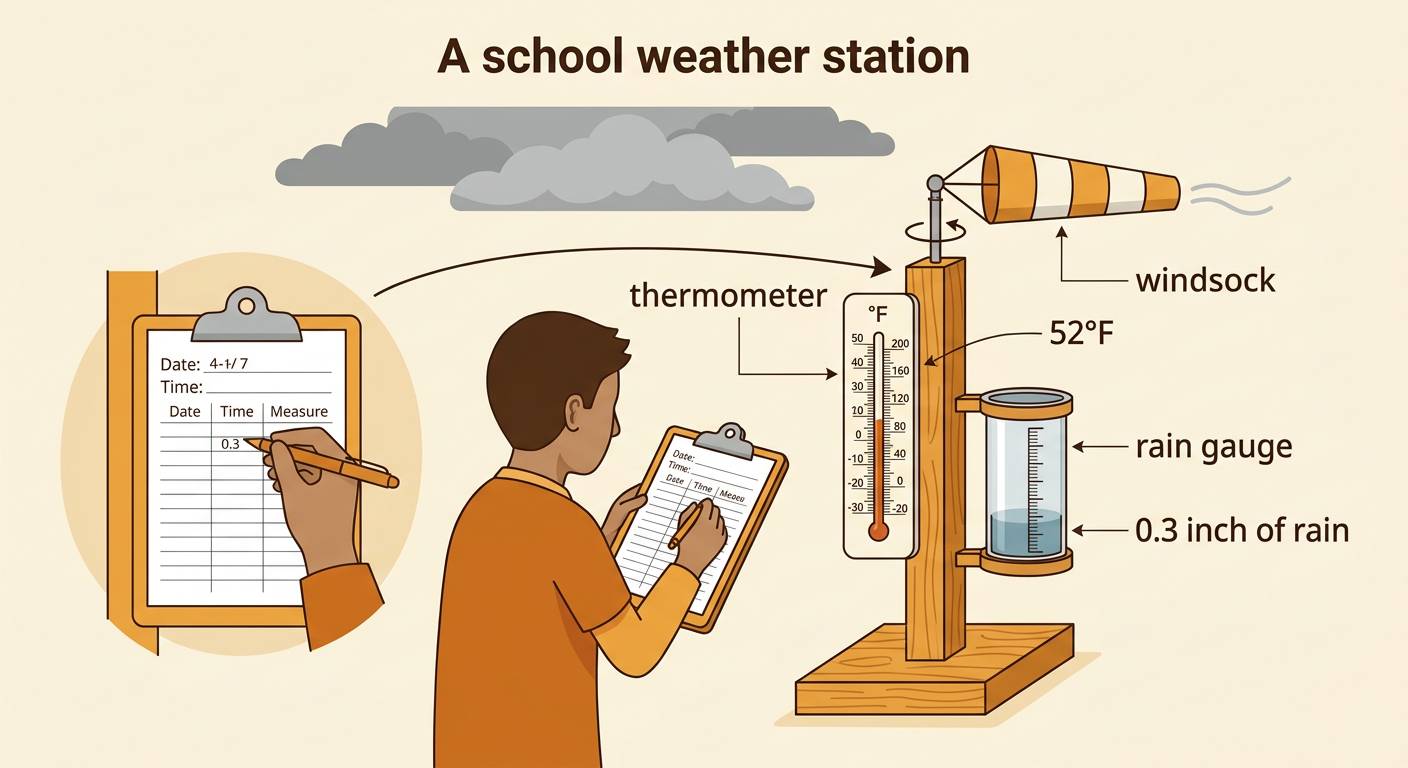
Weather describes what the air outside is like at a certain time and place. Scientists notice temperature, clouds, rain or snow, and wind. They use tools so their observations are consistent. A thermometer measures temperature, a rain gauge collects rainfall, and a windsock shows wind direction and strength. Imagine that students observe the weather at 2:00 p.m. for five school days. On Monday, they record 52°F, cloudy skies, light wind, and 0.3 inch of rain. They should record facts instead of opinions such as “bad weather.” Observing at the same time and place each day makes the data easier to compare. One day does not show a seasonal pattern, but many daily observations can reveal what weather is typical.
Read the Weather Data
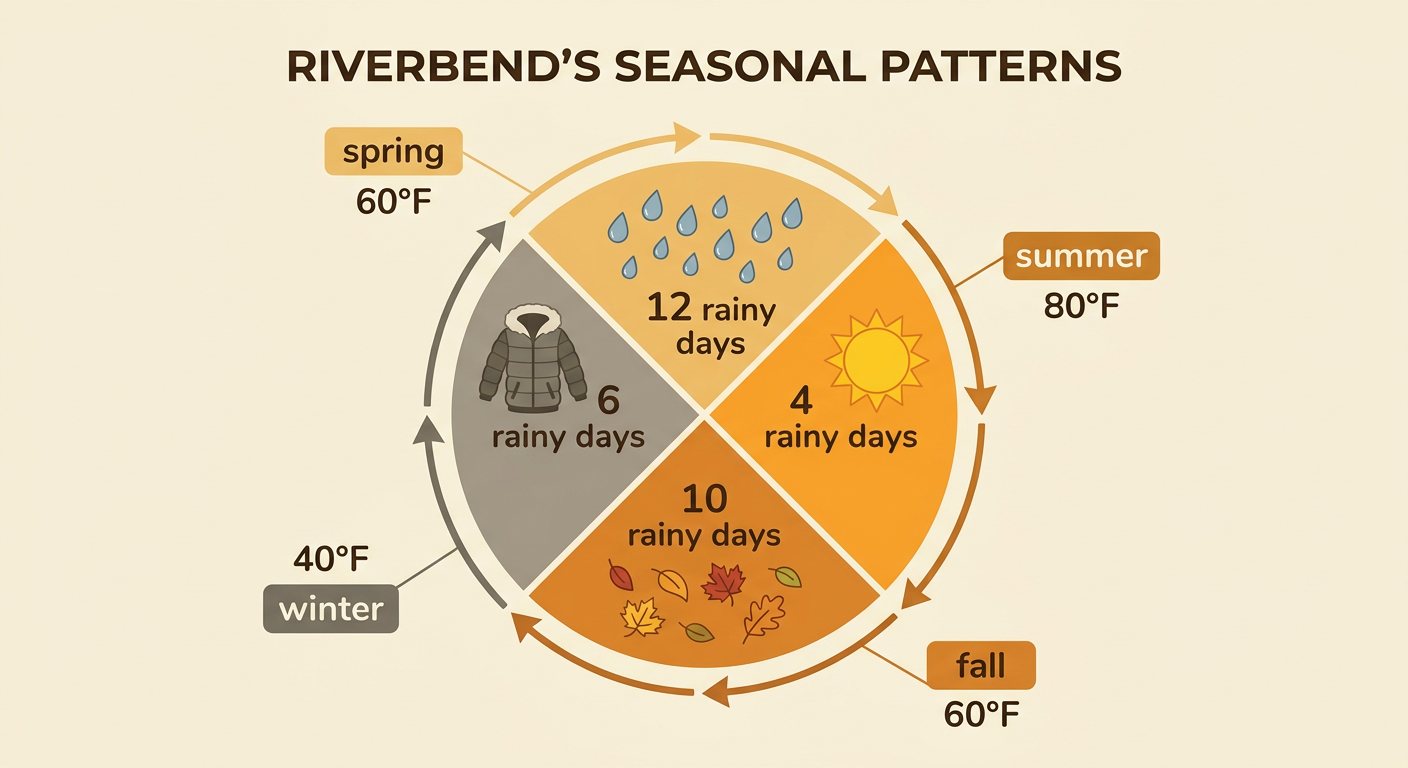
A weather table organizes many observations so patterns are easier to find. The example table shows typical conditions for Riverbend, a made-up town. Its seasonal average afternoon temperatures are 40°F in winter, 60°F in spring, 80°F in summer, and 60°F in fall. The average numbers of rainy days per month are 8 in winter, 12 in spring, 6 in summer, and 10 in fall. Read across each row to connect a season with both measurements. Read down a column to compare the seasons. Summer has the highest average temperature, while spring has the most rainy days. These data describe Riverbend only. Another place could have different temperatures and rainfall because weather patterns vary by location.

Build or Interpret a Graph
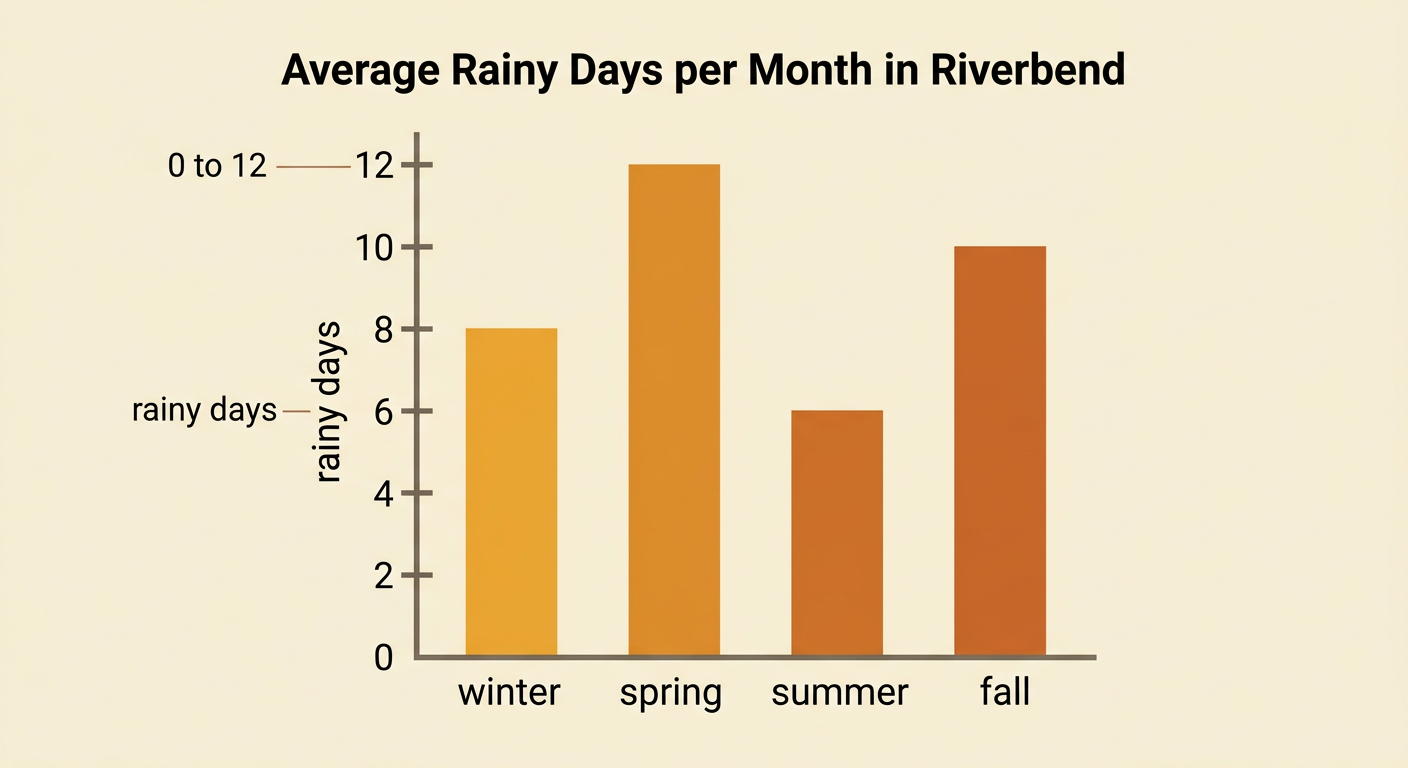
A graph turns numbers into a visual display. To graph Riverbend’s rainy days, draw four bars labeled winter, spring, summer, and fall. Use a vertical scale from 0 to 12, counting by 2. Each grid step represents two rainy days. The winter bar reaches 8, the spring bar reaches 12, the summer bar reaches 6, and the fall bar reaches 10. Every bar should have the same width and begin at zero. Add a title and label both axes. The tallest bar shows that spring has the most rainy days per month. The shortest bar shows that summer has the fewest. The difference is 6 days because 12 minus 6 equals 6. Always use the scale, not just the bar’s appearance, when reading a graph.
Identify Seasonal Patterns
A seasonal pattern is a weather condition that happens often during the same part of the year. Riverbend’s data show that summer is typically the warmest season, with an average afternoon temperature of 80°F. Winter is typically the coolest, at 40°F. Spring has the greatest average number of rainy days, while summer has the fewest. Spring and fall share an average temperature of 60°F, but spring has two more rainy days per month than fall. These comparisons describe typical conditions, not the weather on every day. A summer day can be cool, and a winter day can be warm. Scientists identify patterns by studying data collected over many days and years. They can use the patterns to describe seasons, but they cannot use them to guarantee the weather on one specific date.
Connect Weather to Human Activities
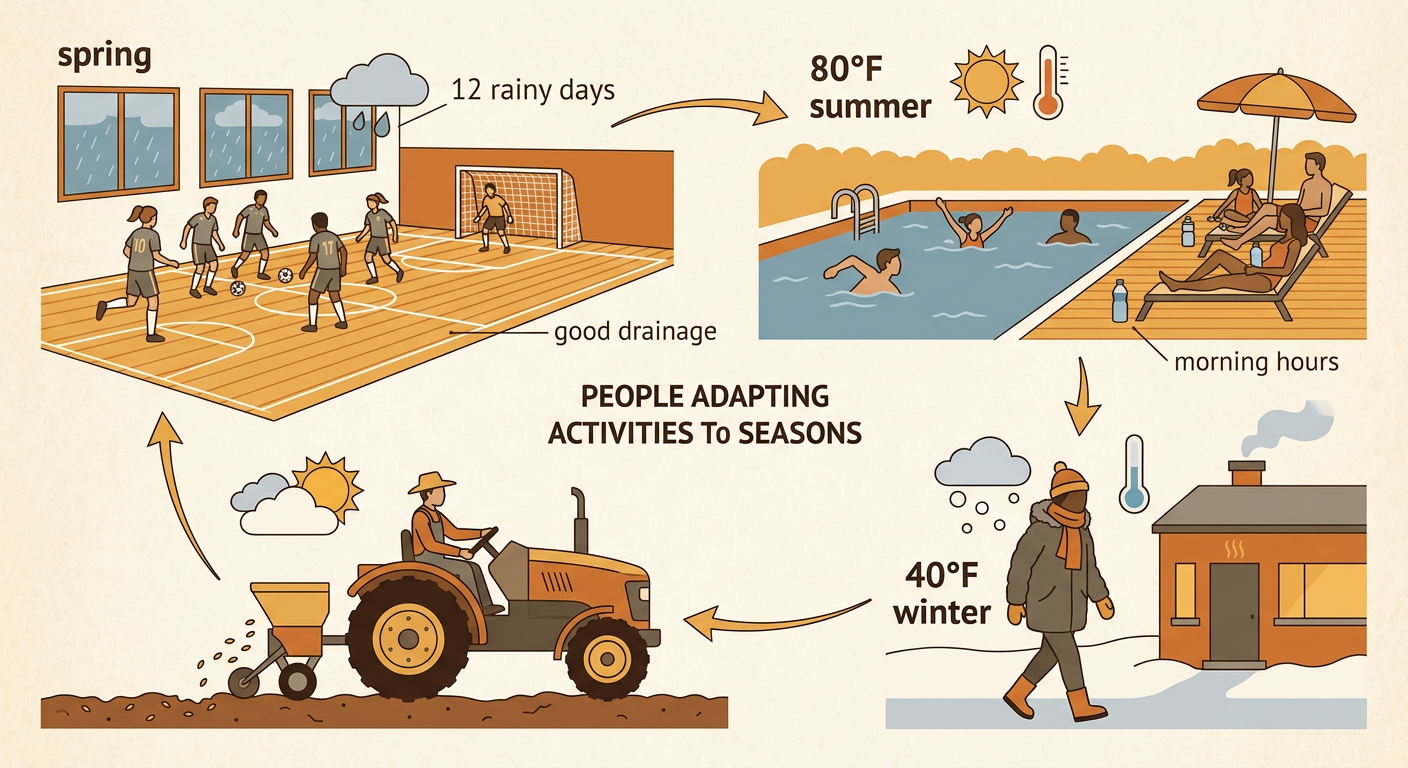
Seasonal weather patterns influence what people do, wear, build, and plan. In Riverbend, spring averages 12 rainy days per month. A soccer team might check the forecast, use a field with good drainage, or move practice indoors when the ground is muddy. During the 80°F summer, families may plan swimming trips, wear lightweight clothing, drink water, and choose morning hours for outdoor exercise. In the cooler 40°F winter, people may wear coats and heat buildings. Farmers also use seasonal patterns when deciding when to plant or harvest crops. These choices are responses to typical environmental conditions. Weather does not completely control people’s activities, but it affects their plans. People also use shelters, clothing, tools, and schedules to stay safe and comfortable in different seasons.
Share an Evidence-Based Claim
An evidence-based claim answers a question and is supported by data. Begin with a clear claim, name the evidence, and explain how the evidence supports the claim. For example: “Spring weather is most likely to interrupt outdoor activities in Riverbend because of rain.” The table and graph show that spring averages 12 rainy days per month. That is more than winter’s 8, summer’s 6, and fall’s 10. More rainy days create more chances for wet fields, slippery paths, or canceled games. The evidence supports the claim because it directly compares rainfall across all four seasons. Avoid claims that are too broad, such as “Spring is always rainy.” The data show a typical pattern, not what happens every day. When sharing, point to the table or graph and use exact numbers in your explanation.
