
Weather Patterns Around Us
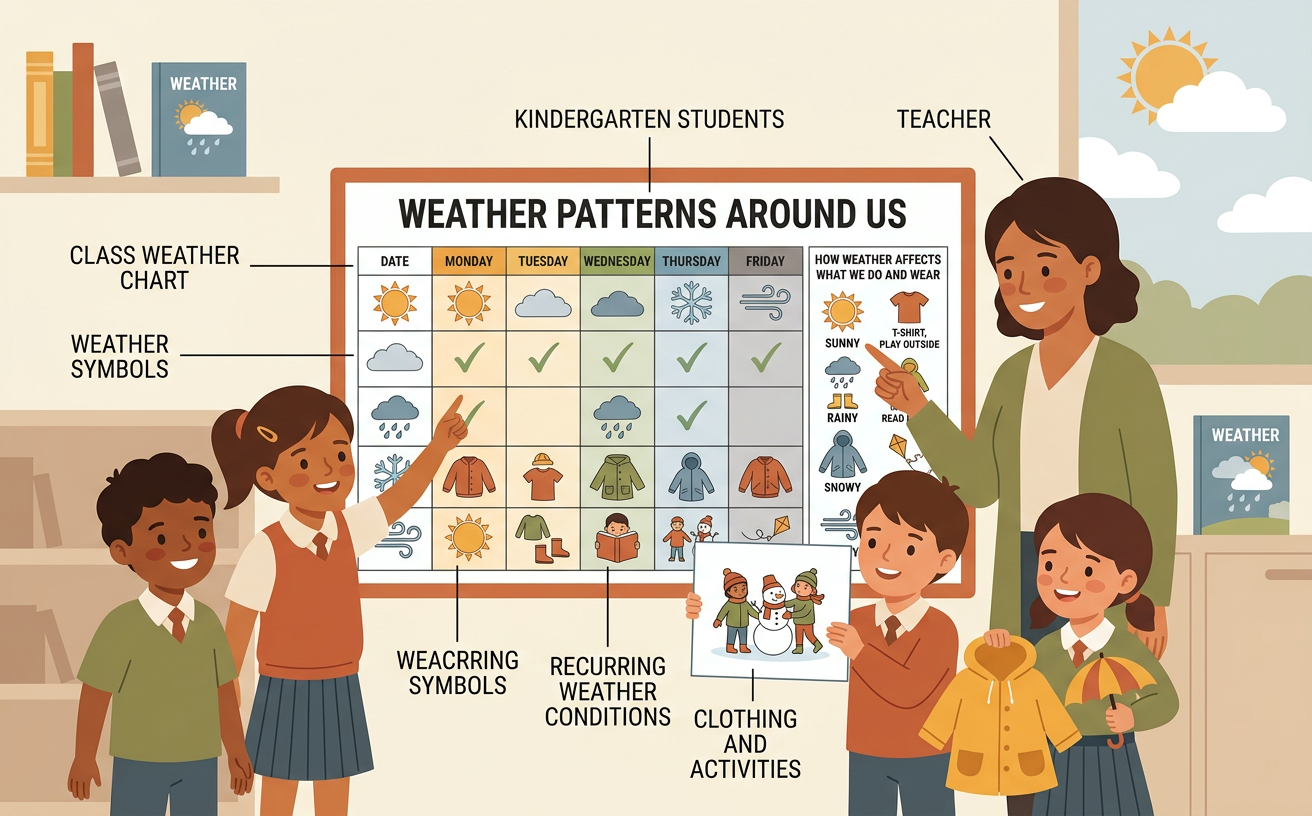
Students examine a class weather chart, identify recurring weather conditions, and discuss how weather affects what people wear and do.
Illustrations are auto-generated and may be placeholders. They can be refreshed to match the narration.
Review the Weather Chart
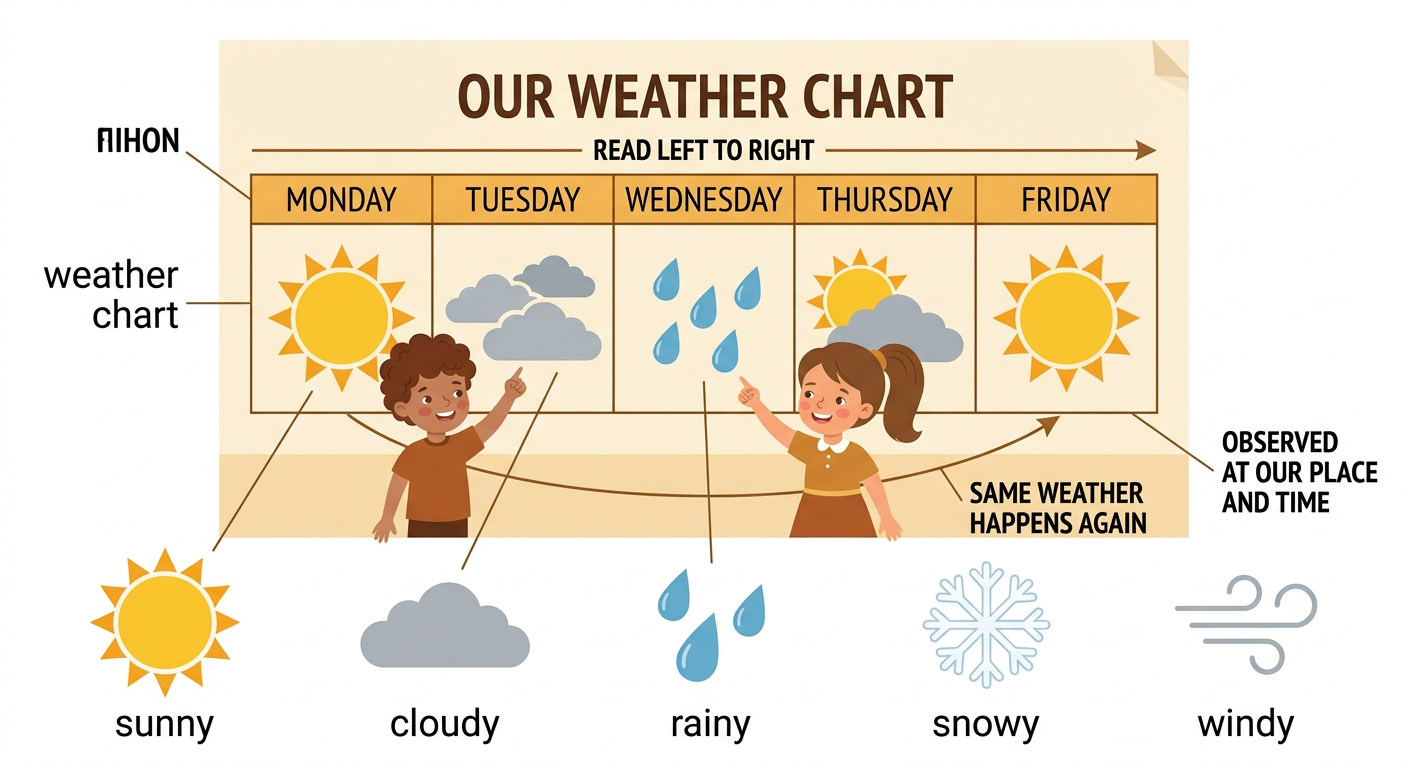
A weather chart helps us remember what the weather was like on different days. Look across the class chart from left to right. Each day may show a symbol for sunny, cloudy, rainy, snowy, or windy weather. Say what you notice and listen while classmates share their ideas. Use an observation sentence such as, “I see three rainy days.” Remember that a chart describes the weather we observed at our place and time. It does not show every kind of weather everywhere. For example, the chart might show a sun on Monday, clouds on Tuesday, and rain on Wednesday. By looking at many days together, we can begin to find weather conditions that happen again.
Observe Today’s Weather
Look outside from a safe place with your teacher. Use your eyes to observe the sky, trees, ground, and people’s clothing. Is the sky sunny or cloudy? Are tree branches moving in the wind? Is rain or snow falling? You can also check a classroom thermometer with an adult to learn whether the air is warmer or cooler. Describe only what you can observe or measure. For example, you might say, “The sky is cloudy, light rain is falling, and people are carrying umbrellas.” Take turns speaking and ask questions about a classmate’s observation. Then choose the weather symbol that best matches today’s conditions and add it to the class chart. Today’s observation becomes one piece of information in the weather record.

Count Weather Types
Now count how many times each kind of weather appears on the chart. Point to every sunny symbol and count slowly: one, two, three. Record the total beside the sunny symbol. Do the same for cloudy, rainy, snowy, and windy days. Make sure each day is counted only once in the class categories. Then compare the totals. Which weather type happened most often? Which happened least often? For example, a ten-day chart might have five sunny days, three cloudy days, and two rainy days. Sunny weather happened most often in that record. Counting helps us use evidence instead of guessing. Share your answer with a partner and explain it by saying, “I counted five sunny days, so sunny weather happened most often.”

Identify a Weather Pattern
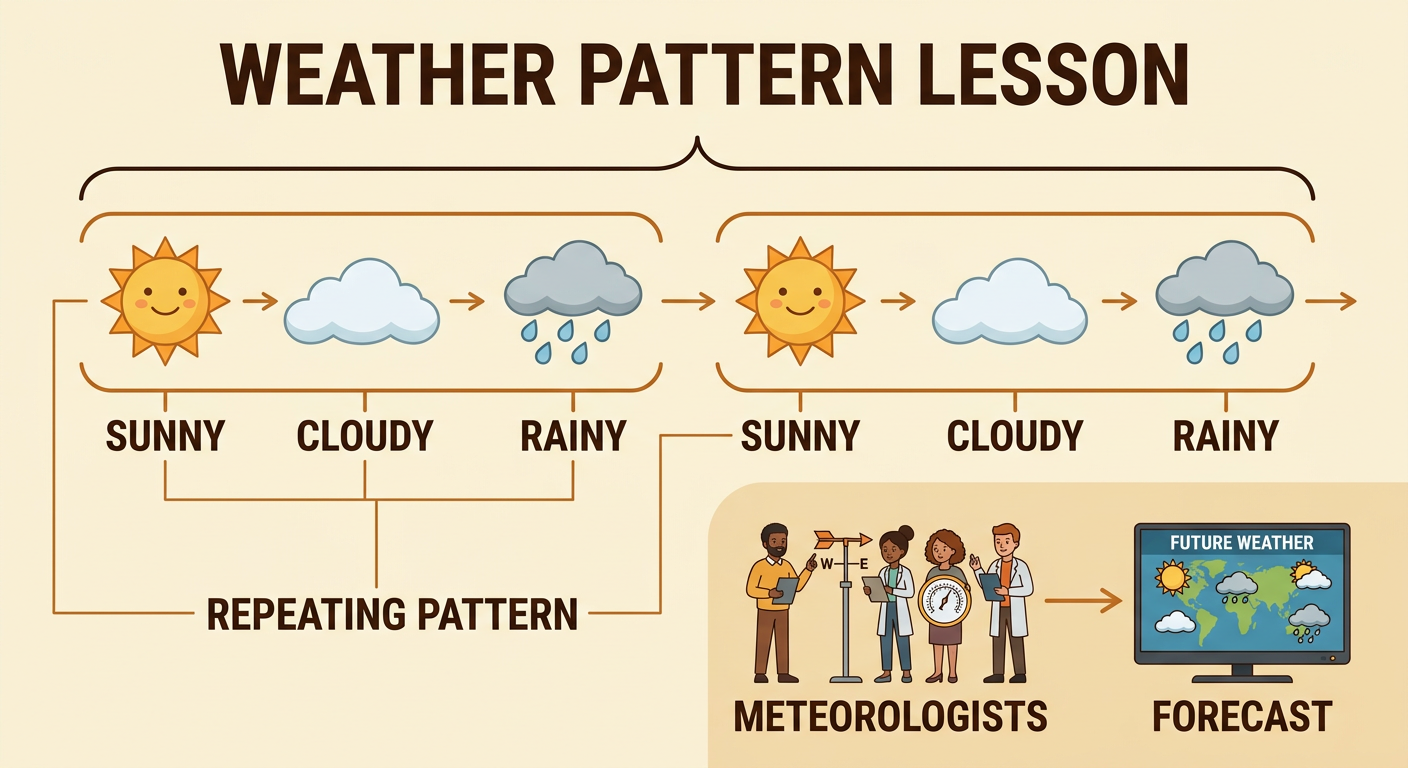
A pattern is something that happens again or happens in a noticeable way over time. Study the order of symbols on the weather chart. You may notice that sunny weather appears on several days, or that rainy days often come next to cloudy days in this short record. For example, the chart may show sunny, cloudy, rainy, sunny, cloudy, rainy. The group of three weather types repeats two times. Point to the repeating parts and describe them aloud: “Sunny, cloudy, rainy; then sunny, cloudy, rainy again.” A short pattern tells what happened on the recorded days, but it does not promise what will happen tomorrow. Meteorologists use many observations and tools to make forecasts. Our class can use its chart to describe patterns we have already observed.
Connect Weather to Daily Life
Weather affects what people wear and what they choose to do. On a cold, snowy day, people may wear coats, hats, gloves, and boots. They might build a snow person, while adults clear snow from sidewalks. On a warm, sunny day, people may wear light clothing and play in the shade. On a rainy day, people may carry umbrellas, wear raincoats, or move a picnic indoors. Wind can make flying a kite possible, but very strong wind may mean people should stay inside and follow safety directions. Talk with a partner about today’s weather and make a suitable choice. For example, say, “It is raining, so I will wear a raincoat for the walk.” Different places have different weather patterns, so people prepare in ways that fit where they live.
