What Dissolves in Water?
Students stir salt, sand, and other safe solids into water and observe that some substances dissolve while others remain visible.

Illustrations are auto-generated and may be placeholders. They can be refreshed to match the narration.
Ask What Happens When Solids Meet Water
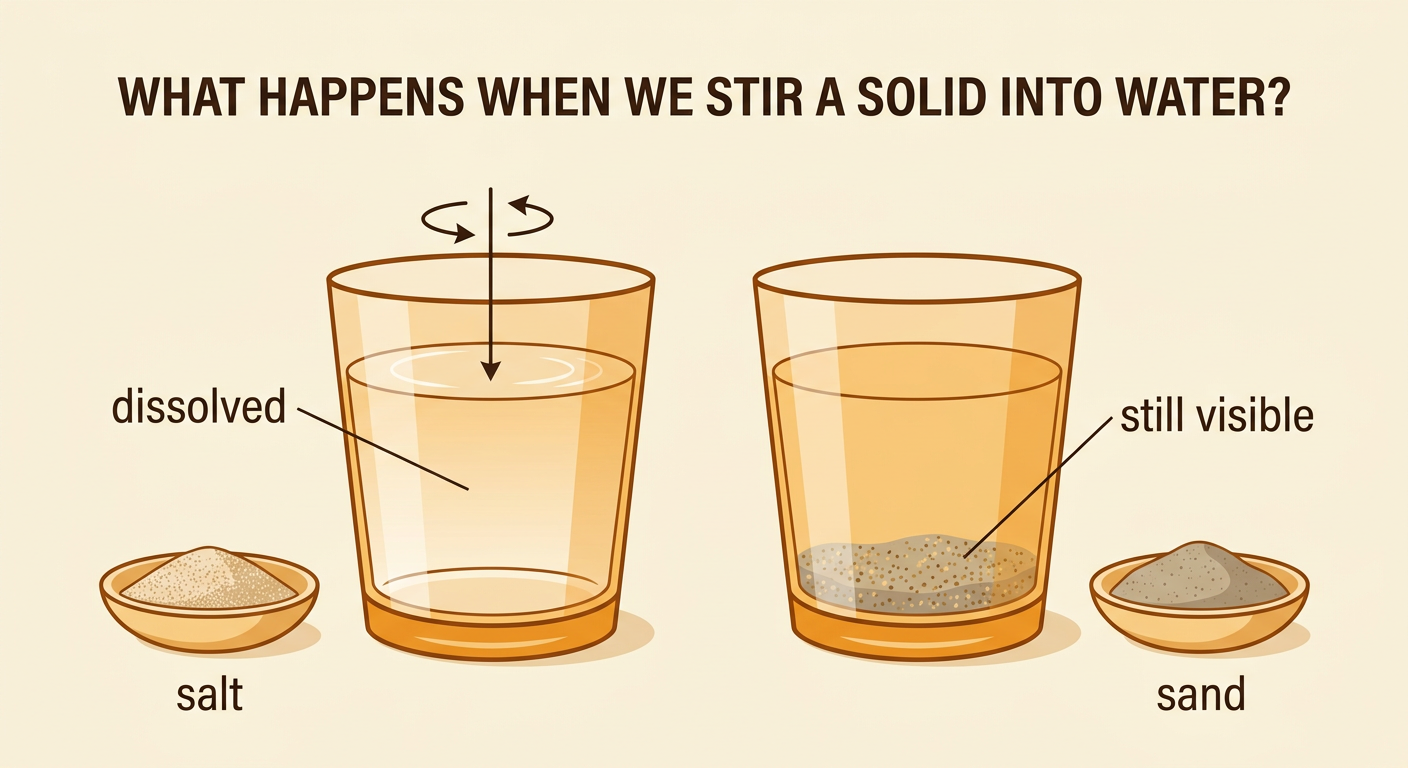
A solid keeps its own shape until something changes it. Salt, sand, sugar, and flour are examples of solids. Water is a liquid. What might happen when a spoonful of a solid is stirred into water? Some solids dissolve. When a solid dissolves, its tiny pieces spread throughout the water and can no longer be seen. The solid is still in the water; it did not vanish. Other solids do not dissolve and remain visible. They may float, sink, or make the water cloudy. For example, salt may seem to disappear after stirring, but sand grains usually settle at the bottom. We can use our eyes and careful observations to answer the question: Which solids dissolve in water?
Predict Which Solids Will Dissolve
Before testing, make a prediction. A prediction is what you think will happen based on what you already know or notice. Look closely at each safe solid without tasting it. Notice its color, grain size, and texture. You might test salt, sugar, sand, and flour. Sort picture cards or samples into two predicted groups: will dissolve and will stay visible. For example, you may predict that sugar will dissolve because you have seen sugar stirred into a drink. You may predict that sand will stay visible because sand remains on the ground after rain. Tell a partner your prediction and reason. Listen while your partner shares. Predictions do not have to be correct. The investigation will give everyone observations that can help answer the question.

Mix and Observe Safely
Work with a partner and follow the same steps for every solid. Wear safety goggles, keep materials away from your mouth, and wash your hands afterward. Never taste the water or solids. Label a clear cup for each material and add the same amount of water to every cup. An adult can help measure. Put one level spoonful of salt into its cup. Stir slowly for the same amount of time, such as 20 counts. Stop and look from the side and top. Record what you see. Then use a clean spoon to test the next solid. For example, sugar may become hard to see after stirring, while flour may make the water cloudy and leave small clumps. Keeping the amount and stirring time the same makes the comparison fair.

Record Dissolved or Still Visible
Use an observation table to record what happens in each cup. Write or draw the solid’s name in the first column. In the next column, mark dissolved if no pieces remain visible after careful stirring. Mark still visible if you can see grains, clumps, floating pieces, or material at the bottom. You can also draw the cup. For example, the salt row might have a tally mark under dissolved. The sand row might have a tally mark under still visible and a drawing of grains on the bottom. Count the tally marks in each category. Then compare the totals using words such as more, fewer, or equal. Record only what you observe, even if it differs from your prediction. Clear notes and drawings help the class remember the evidence.

Compare Results and Explain
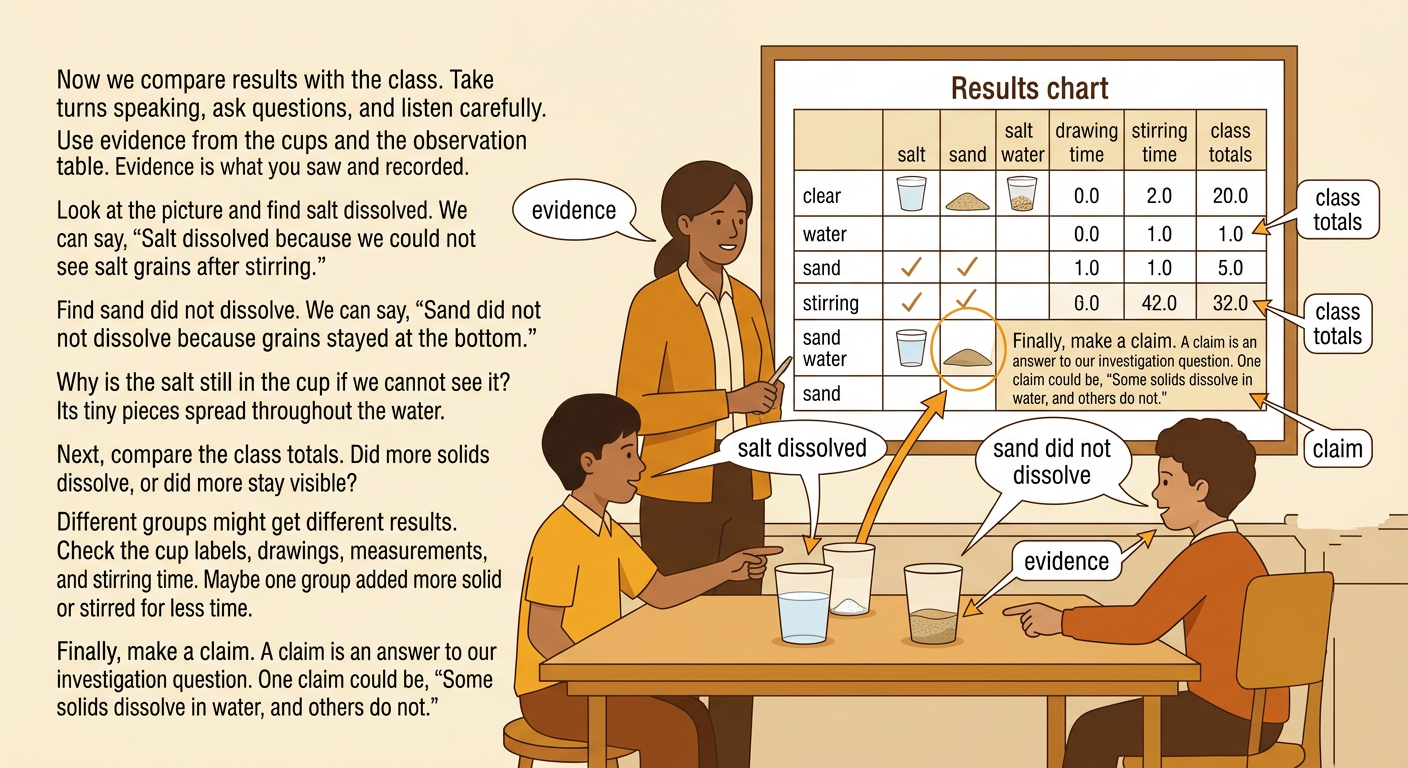
Share your results with the class and compare them with other groups. Take turns speaking, ask questions, and listen for observations that match or differ. Use evidence from the cups and data table. You might say, “Salt dissolved because we could not see salt grains after stirring.” You might add, “Sand did not dissolve because grains stayed at the bottom.” Remember that dissolved salt is still present even though it is not visible. Compare the class totals. Did more tested solids dissolve, or did more stay visible? If groups got different results, check helpful sources: cup labels, drawings, stirring steps, measurements, and classmates’ observations. Perhaps one group used more solid or stirred for less time. End with a claim that answers the investigation question and one observation that supports it.