
When Ecosystems Change: Building an Evidence-Based Argument
Students analyze evidence to explain how a change in an ecosystem’s physical or biological components can affect its populations.

Illustrations are auto-generated and may be placeholders. They can be refreshed to match the narration.
Ecosystem Components and Populations
An ecosystem includes living components, such as plants, animals, fungi, and bacteria, and nonliving components, such as water, sunlight, soil, air, and temperature. These components interact. A population is all the organisms of one species living in the same area at the same time. For example, a pond ecosystem may contain a population of frogs. The frogs depend on insects for food, plants for shelter, and water for reproduction. If one component changes, the frog population may also change. However, an effect should not be assumed without evidence. Scientists collect observations and measurements, such as population counts, rainfall totals, and food availability, to determine whether and how ecosystem components are connected.

Physical and Biological Changes
A physical change affects a nonliving part of an ecosystem, while a biological change affects a living part. Drought, flooding, fire, and temperature shifts are physical changes. Disease, invasive species, predator loss, and changes in food supply are biological changes. Consider a grassland during a long drought. Reduced rainfall causes less grass to grow. With less food available, the rabbit population may decline or move away. Foxes may then have fewer rabbits to eat, which can also affect the fox population. This example shows a chain of effects rather than a single isolated event. The size and direction of each population change depend on factors such as the drought’s length, the organisms’ needs, and the availability of other resources.

Reading Population Evidence
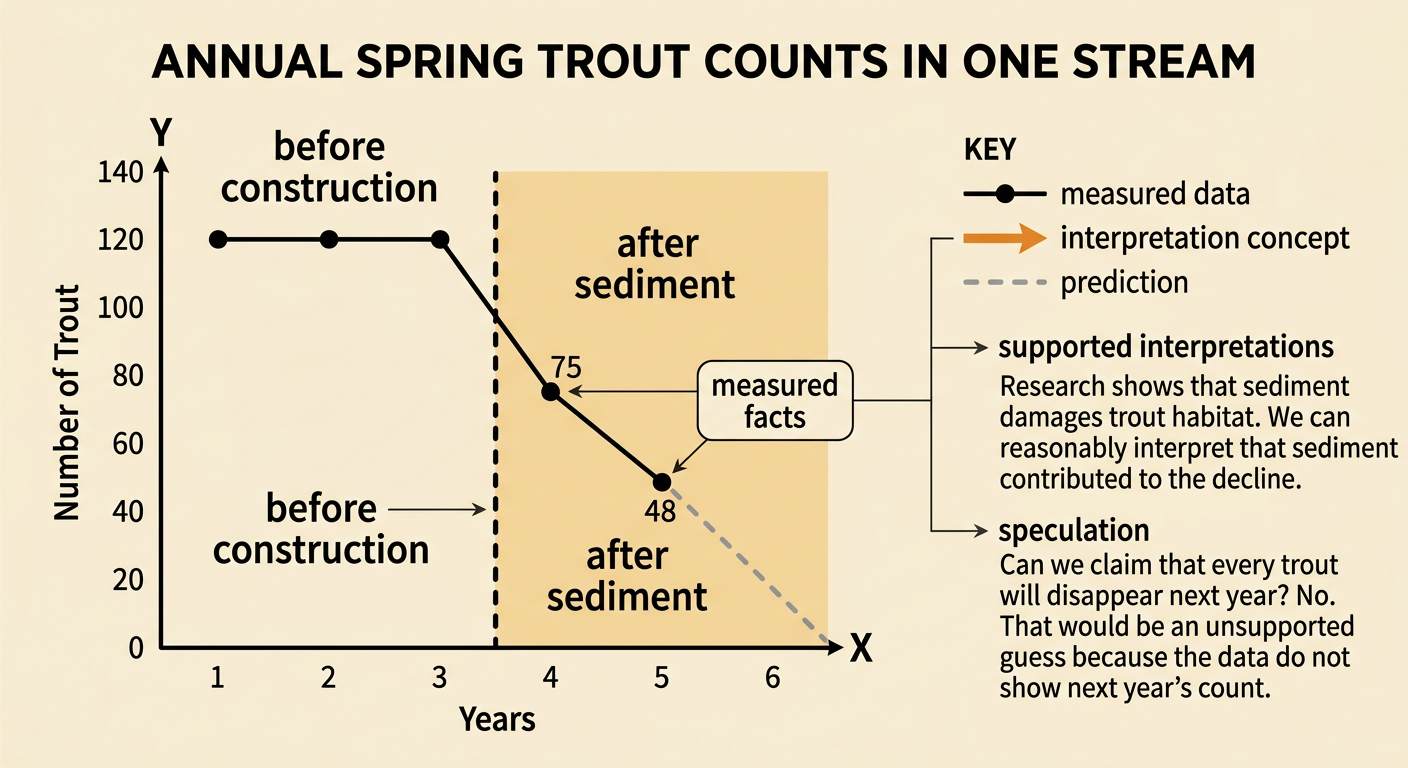
Population evidence often appears in tables, graphs, field notes, or repeated counts. Begin by identifying what was measured, where it was measured, and over what time period. Then look for patterns, such as increases, decreases, or stability. Suppose researchers counted trout in the same stream each spring. Before nearby construction, they counted about 120 trout each year. After sediment entered the stream, counts fell to 75 and then 48. These measurements are facts reported by the study. Saying sediment likely contributed to the decline is a reasoned judgment if evidence connects sediment with poorer trout habitat. Saying all trout will disappear next year is speculation unless additional evidence supports that prediction. Strong analysis clearly separates measured facts, supported interpretations, and unsupported guesses.
Checking Source Credibility
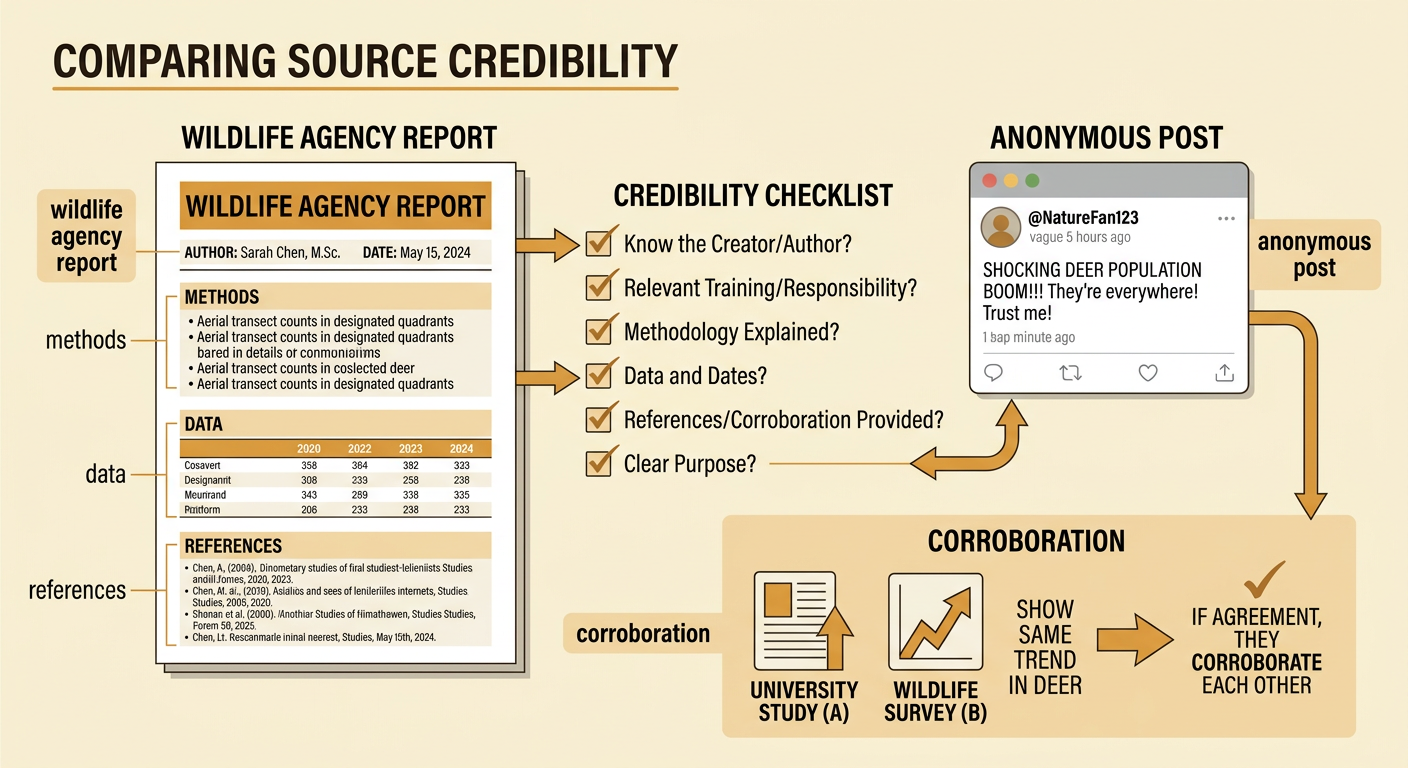
A credible source provides information that is trustworthy enough to use as evidence. Check its origin by asking who created it and where it was published. Check authority by examining the author’s relevant training or role. Study the source’s structure for methods, data, dates, and references. Consider context, including the purpose of the source and whether it may be biased. Finally, look for corroboration, which means agreement with other reliable sources. For example, a dated wildlife agency report that explains how deer were counted is generally stronger than an anonymous post claiming that deer have vanished. If a university study and an agency survey report similar trends, they corroborate each other. Credibility does not mean a source is perfect, but it helps determine how much weight its evidence deserves.
Claim, Evidence, and Reasoning
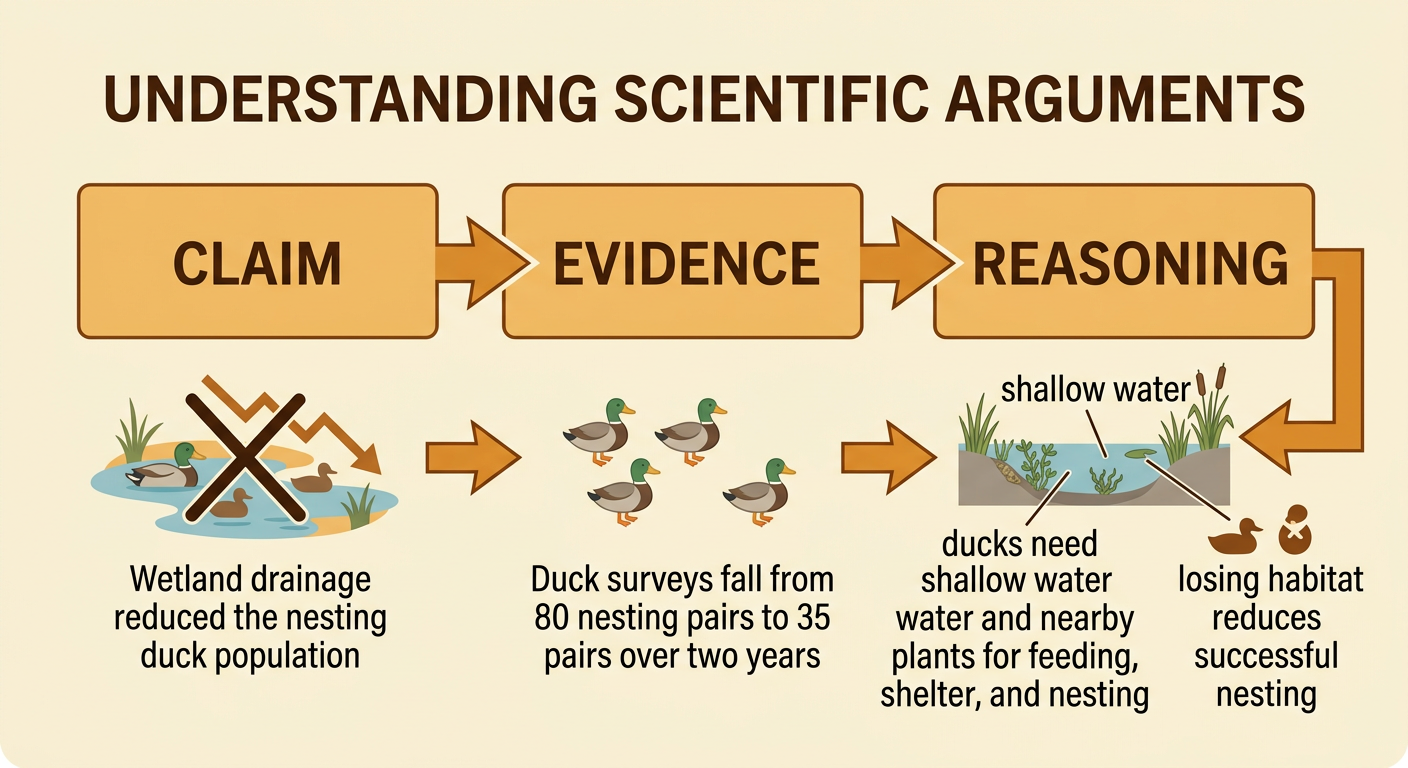
A scientific argument includes a claim, evidence, and reasoning. The claim answers the investigation question. Evidence consists of relevant observations or measurements from credible sources. Reasoning explains why the evidence supports the claim by using scientific ideas. Imagine that a wetland loses half of its shallow water after drainage. Surveys show that the number of nesting ducks falls from 80 pairs to 35 pairs over two years. A claim might state that wetland drainage reduced the nesting duck population. The survey counts are evidence. The reasoning explains that ducks need shallow water and nearby vegetation for feeding, shelter, and nesting, so losing that habitat can reduce successful nesting. A strong argument does not simply repeat the numbers; it connects them logically to the ecosystem change and acknowledges other possible influences.
Defending an Ecosystem Argument
Defending an argument means presenting it clearly, answering questions, and responding to competing explanations with evidence. First, state the ecosystem change and the population effect you claim occurred. Cite specific data and explain why each source is credible. Then describe the scientific relationship connecting the change to the population. For example, if mussel numbers declined after water temperature rose, compare counts from before and after the warming and use reliable research about the mussels’ temperature tolerance. A classmate might argue that pollution caused the decline instead. Examine water-quality measurements to see whether that explanation is supported. Revise your claim if stronger evidence appears. Scientific arguments are not contests won by speaking loudly; they are explanations strengthened by accurate data, credible sources, logical reasoning, and careful responses to alternative ideas.
