When the Cell Cycle Loses Control: Cancer Biology
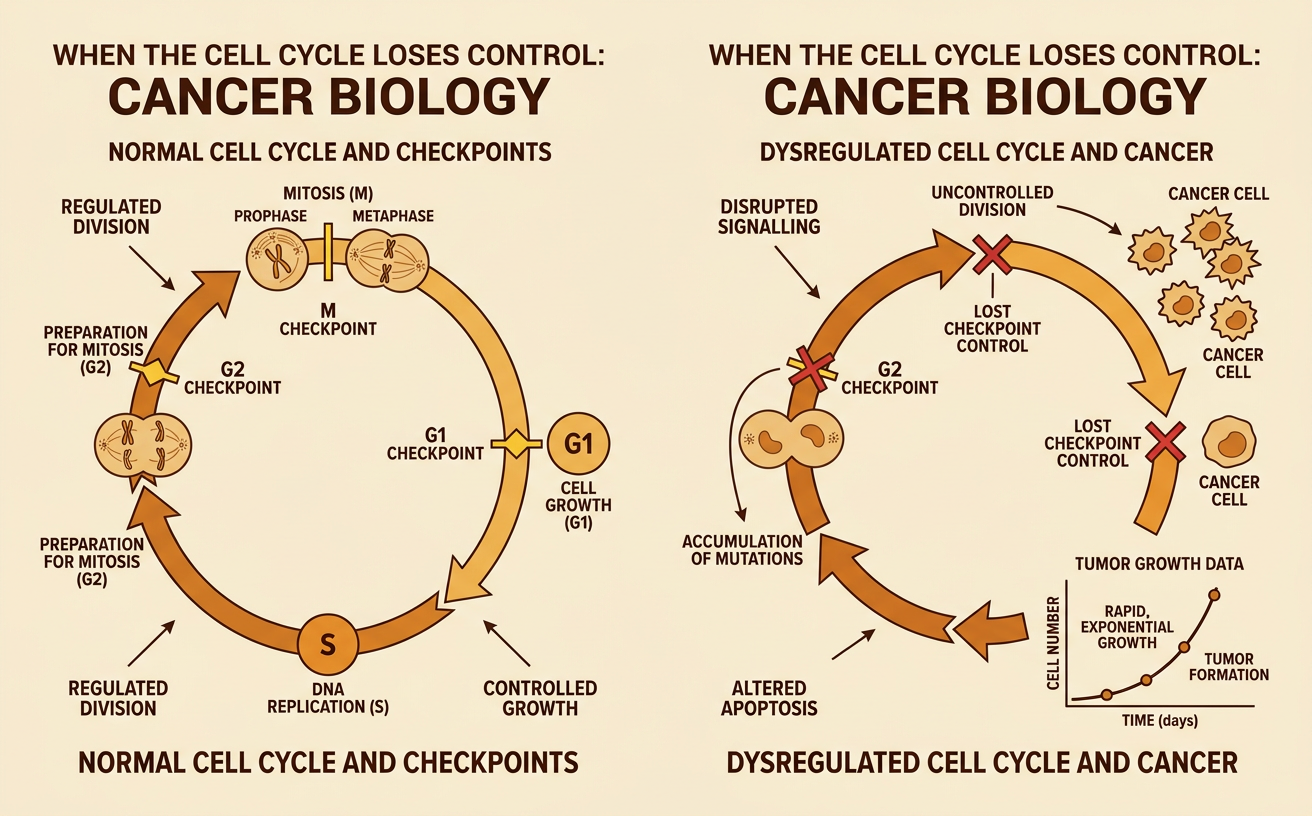
Students use a cell-cycle model and tumor-growth data to explain how disrupted checkpoints can lead to uncontrolled cell division and cancer.
Illustrations are auto-generated and may be placeholders. They can be refreshed to match the narration.
Cell-Cycle Stages and Checkpoints
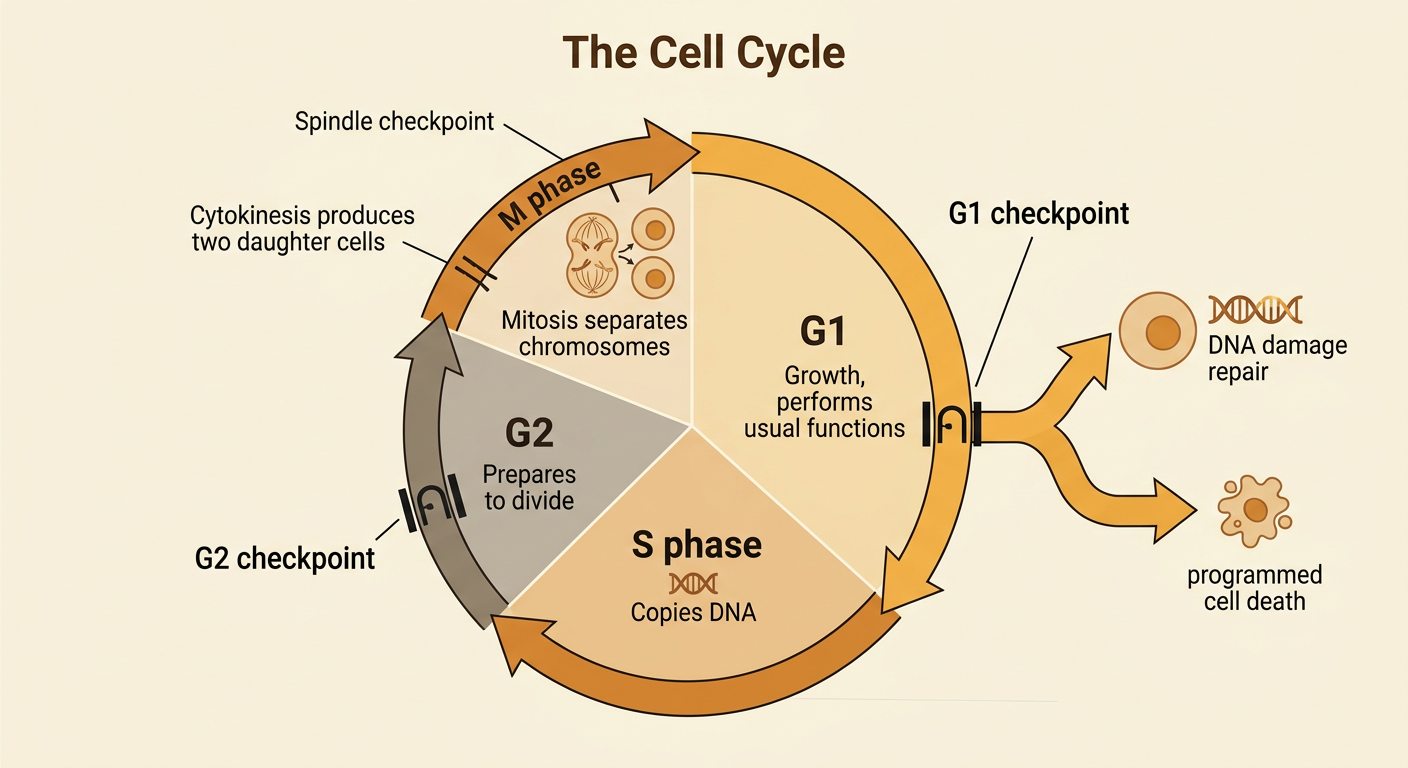
The cell cycle is a regulated sequence that allows organisms to grow, replace cells, and maintain tissues. During G1, a cell grows and carries out normal functions. In S phase, it copies its DNA. During G2, it prepares for division, and in M phase, mitosis and cytokinesis produce two daughter cells. Checkpoints act like inspection points. The G1 checkpoint evaluates cell size, nutrients, growth signals, and DNA damage. The G2 checkpoint checks whether DNA replication is complete. The spindle checkpoint confirms that chromosomes are correctly attached before separation. For example, ultraviolet radiation may damage DNA in a skin cell. Checkpoint proteins can pause the cycle so repair occurs. If damage cannot be repaired, the cell may enter programmed cell death instead of passing harmful DNA to daughter cells.
How Mutations Disrupt Regulation
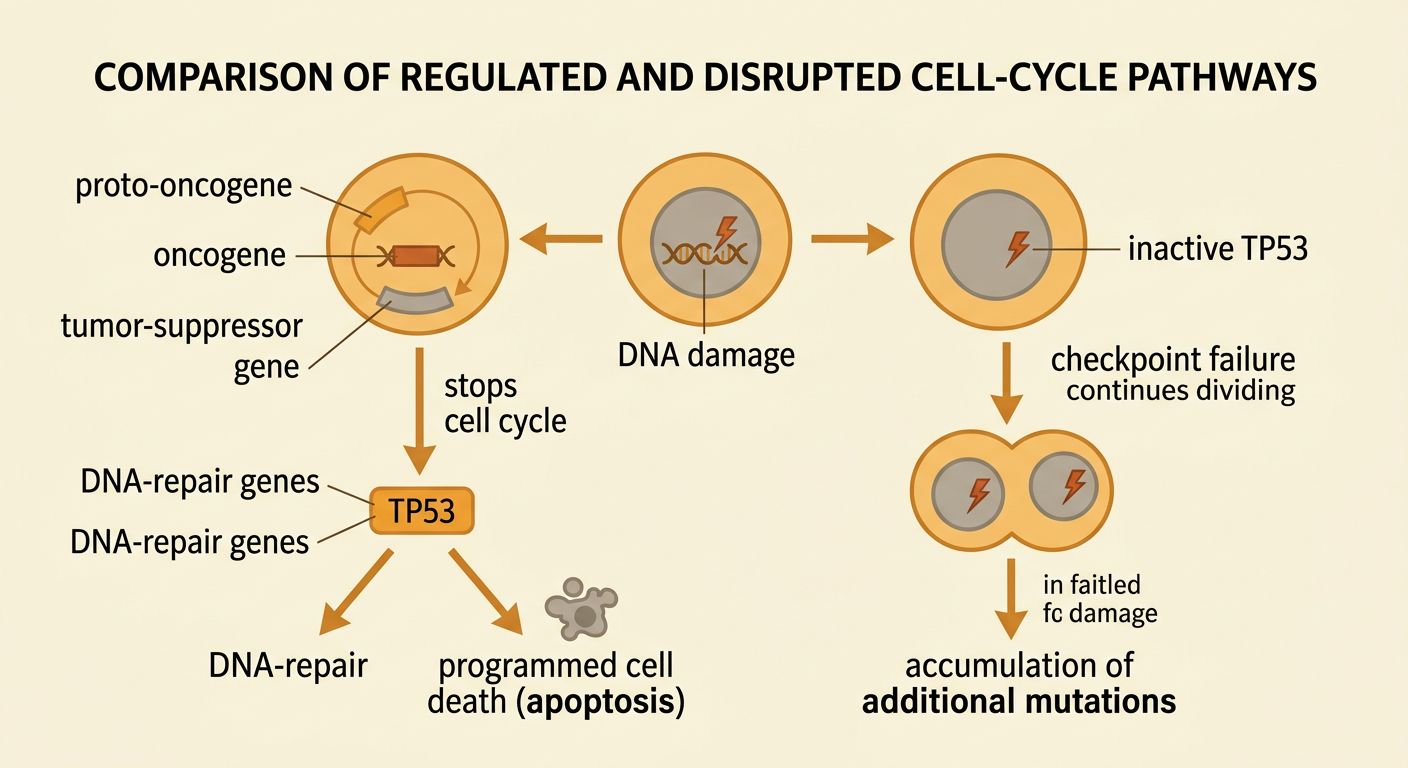
Cell-cycle regulation depends on genes that produce proteins controlling division, DNA repair, and cell death. Proto-oncogenes normally promote division only when appropriate. A mutation can convert one into an oncogene that sends an excessive growth signal. Tumor-suppressor genes normally slow the cycle, repair damage, or trigger cell death; loss-of-function mutations can remove these protections. Mutations in DNA-repair genes allow additional errors to accumulate. For example, the TP53 tumor-suppressor gene helps stop the cycle when DNA is damaged. If both copies become inactive, a damaged cell may continue dividing rather than repairing itself or dying. Cancer usually develops through several mutations over time, not from a single change. Inherited variants can increase risk, while other mutations arise from replication errors or environmental exposures such as tobacco smoke or ultraviolet radiation.
Modeling Uncontrolled Cell Division
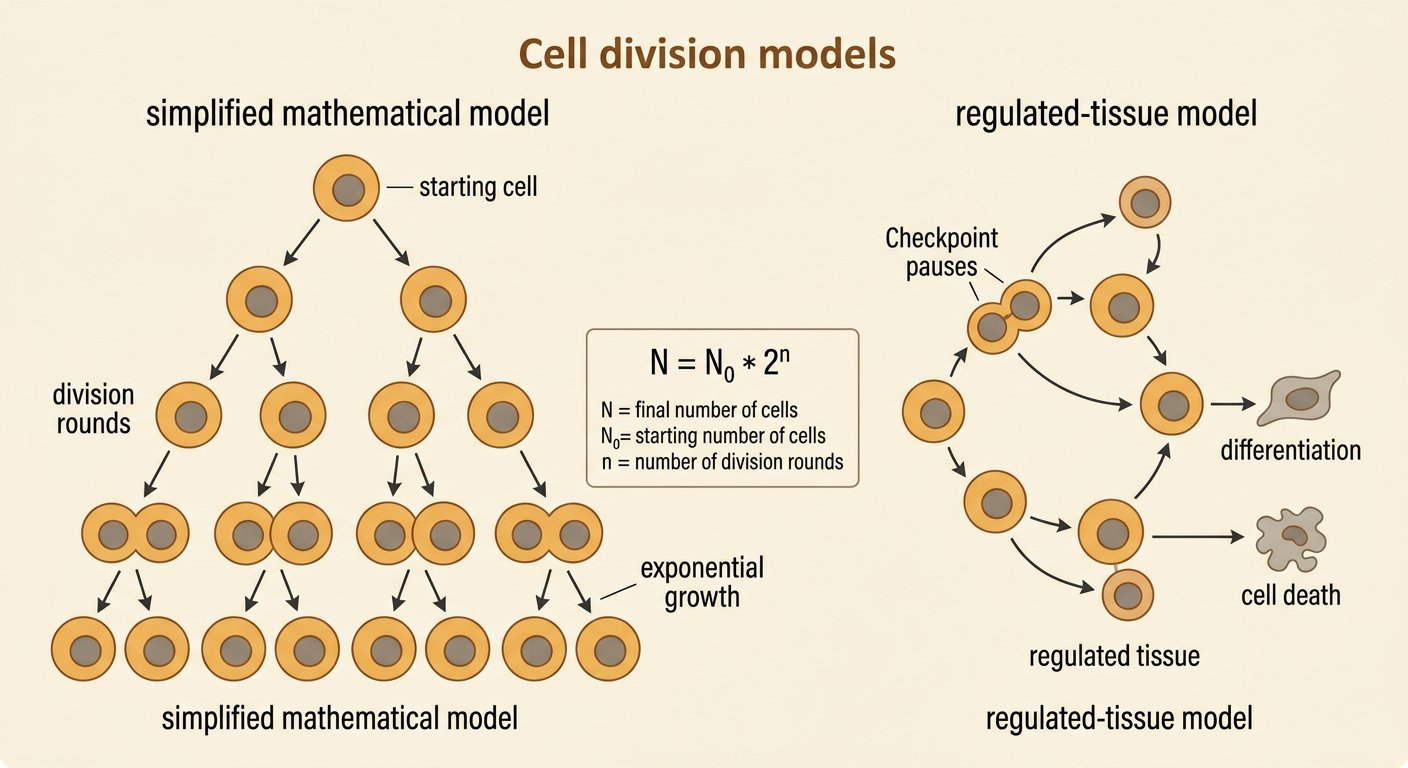
A simplified model can show why repeated cell division produces rapid growth. If every cancer cell divides into two surviving cells during each cycle, the population follows N = N0 × 2^n, where N0 is the starting number and n is the number of division rounds. Starting with one abnormal cell, ten rounds would produce 1,024 cells because 2^10 = 1,024. Twenty rounds would produce more than one million cells. This exponential model contrasts with regulated tissues, where checkpoint pauses, differentiation, and cell death balance new cell production. The model is useful but incomplete: real tumors contain cells with different cycle lengths, and some cells die or lack oxygen and nutrients. Immune responses and treatments also affect growth. Therefore, the model illustrates how lost regulation can drive expansion without claiming that every tumor doubles at a constant rate forever.
Interpreting Tumor-Growth Data
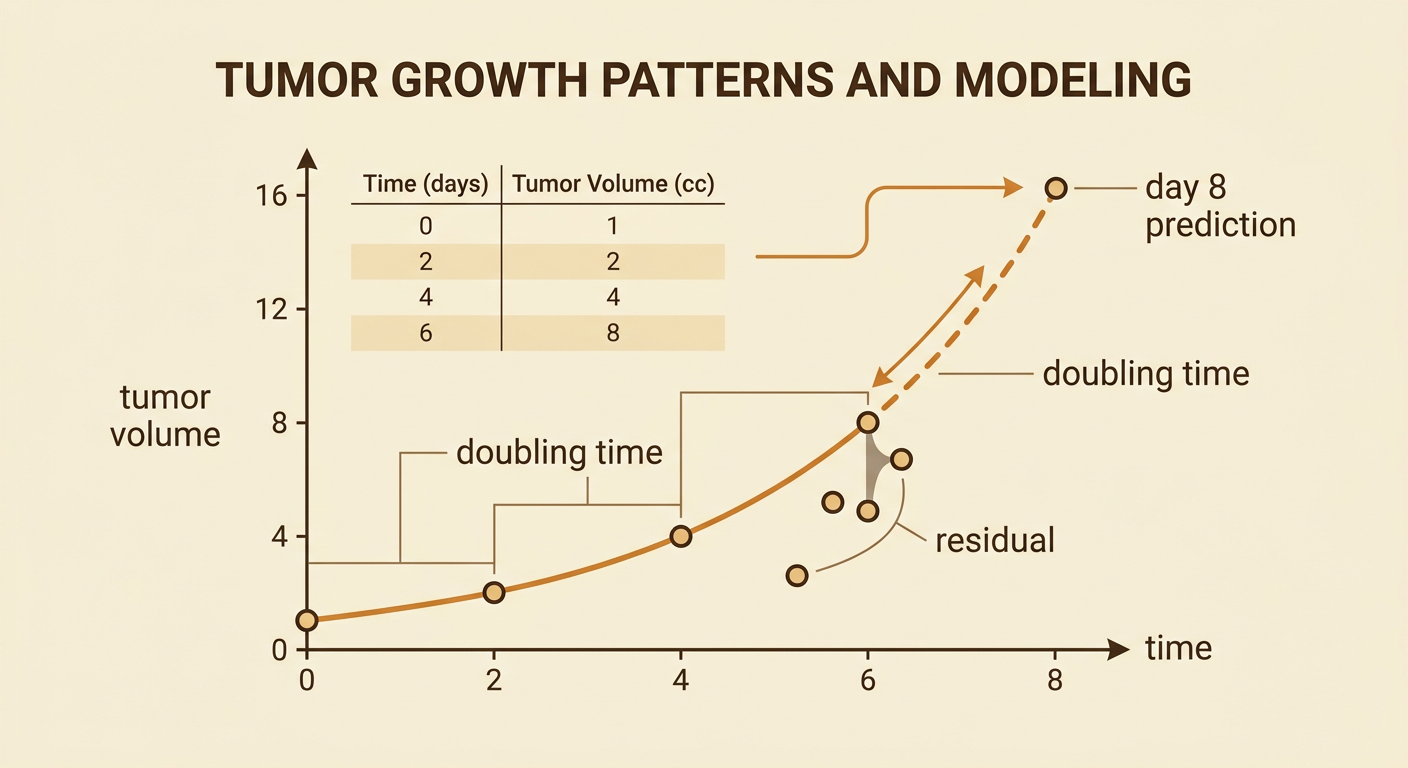
Tumor-growth data can be displayed in a table, scatterplot, medical image series, or fitted function. Suppose measured tumor volumes are 1, 2, 4, and 8 cubic centimeters on days 0, 2, 4, and 6. These points fit the exponential function V = 2^(t/2), where V is volume and t is time in days. The model indicates a doubling time of two days and predicts a volume of 16 cubic centimeters on day 8. Students should compare predicted values with observed values and examine residuals rather than accepting a model only because it looks curved. Real data may fit an exponential model during an early interval but slow later because of limited resources or treatment. Imaging measurements also contain uncertainty. Combining numerical data, a graph, and information about treatment timing produces a stronger interpretation than relying on any single source.
Evidence-Based Cancer Explanation
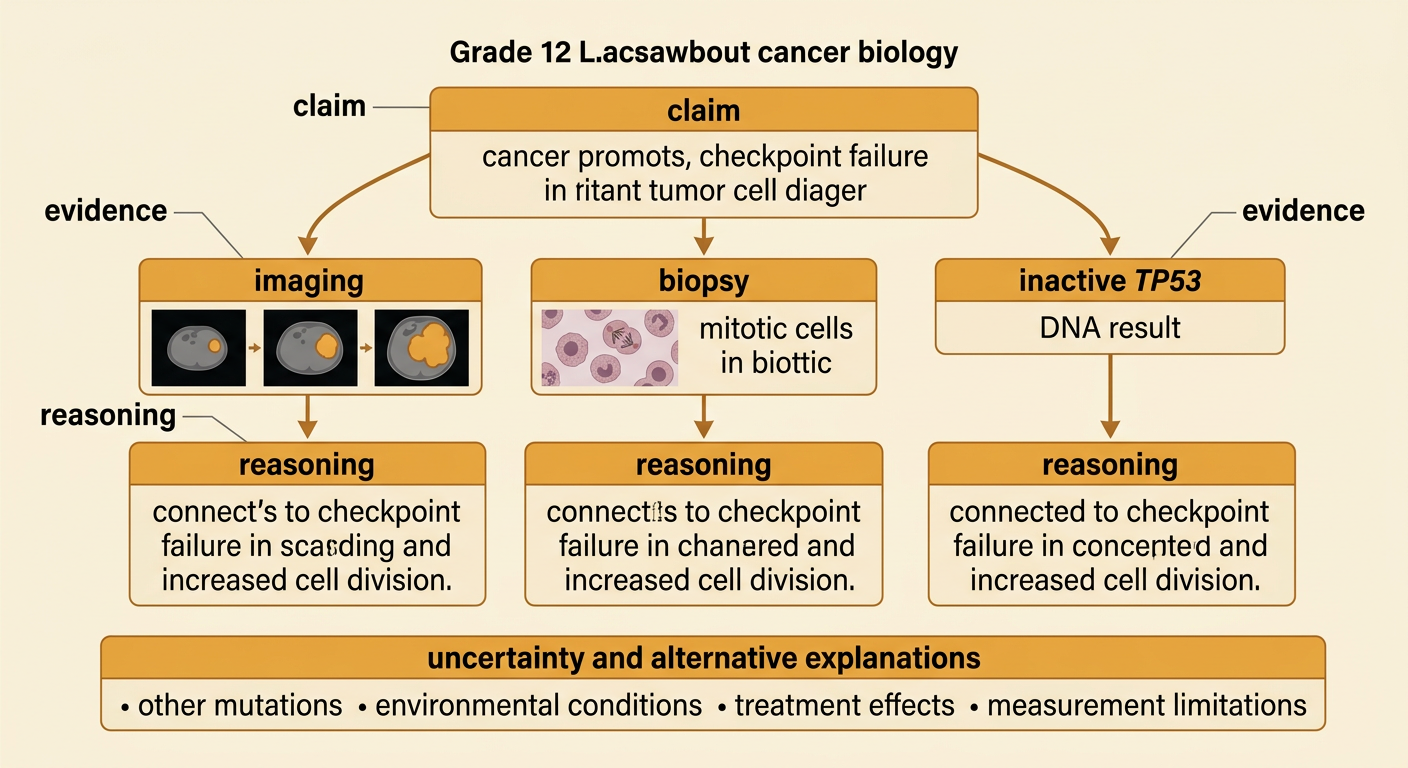
A strong scientific explanation makes a precise claim, cites evidence from multiple sources, and connects that evidence with biological reasoning. Consider a patient whose imaging shows increasing tumor volume, whose biopsy shows many cells in mitosis, and whose DNA analysis identifies inactive TP53 genes. A supported claim is that disrupted checkpoint regulation contributed to uncontrolled cell division in the tumor. The imaging provides population-level growth evidence, the biopsy provides cellular evidence, and the genetic result provides a possible molecular mechanism. Reasoning links them: loss of TP53 activity can allow DNA-damaged cells to continue through the cycle, increasing the number of dividing descendants. However, the evidence does not prove that TP53 loss acted alone. Other mutations, environmental conditions, and measurement limitations must be considered. An effective argument distinguishes correlation from causation, addresses alternative explanations, and states what additional evidence would strengthen or challenge the conclusion.